Columnar Formats in Data Lakes
Columnar data formats have become the standard in data lake storage for fast analytics workloads as opposed to row formats. Columnar formats significantly reduce the amount of data that needs to be fetched by accessing columns that are relevant to the workload. Let’s look at how this is happening with an example.
Analytical queries on stocks represent a multi-billion dollar business in the US because companies use these queries to understand sales trends and understand stock buying and selling patterns. Analytic queries mostly involve scans of the data. As an example, let’s try to query the average price for TESLA stock this year. TESLA is a popular stock and there are going to be multiple records the below scan will be a good way to evaluate this query.
Select avg(price)
FROM STOCKDATA
WHERE symbol = ‘TSLA’ AND date >= ‘2020/01/01’
In order to understand how columnar formats optimize the scan, let’s look at how row data formats read through this first.
Intuitively, the amount of time it takes to read is proportional to the amount of data we access in processing the query.
Columnar Storage
In a storage system, data is laid out in concentric rings and the data that is being read now is under the triangular structure called the head. When the disk rotates and data passes off the head, it is read from the disk. Each ‘x’ here represents a column for the record.
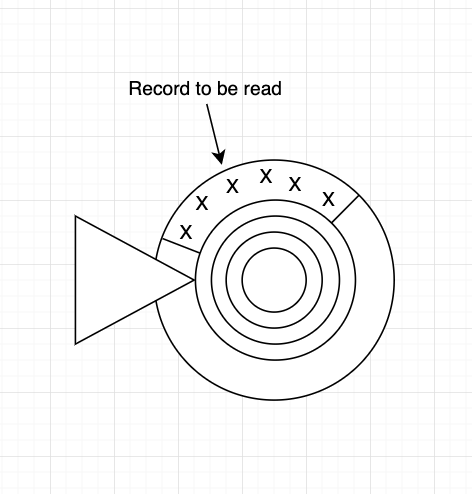
So, if you want to read three columns that are randomly allocated, we need to read through the entire record before we move on to the next record. So the time to scan the data will be the time it takes to read through the entire columns for these records.
Columnar Data
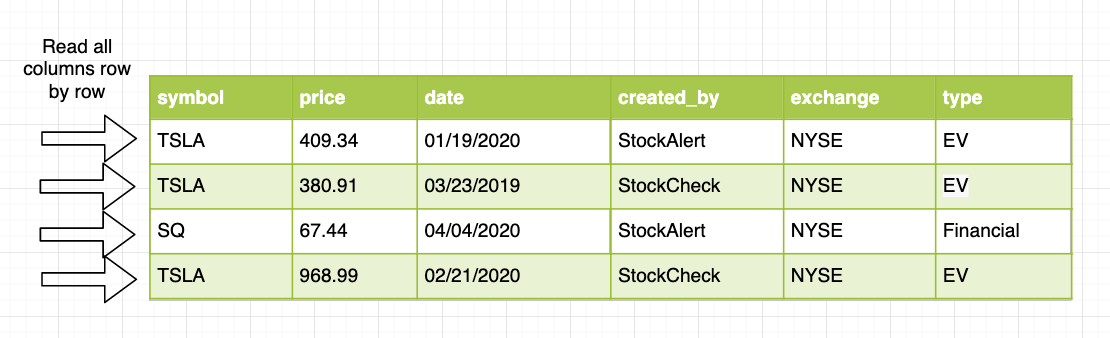
Even though the query above needs to access price, symbol, and date columns; when the data is laid out in a row-by-row fashion on the storage disk, we will end up reading all 6 columns in the data.
For 1 billion records assuming 100 Bytes each = 100GB at 100 MB/sec, it takes about 1000 seconds to read the data.
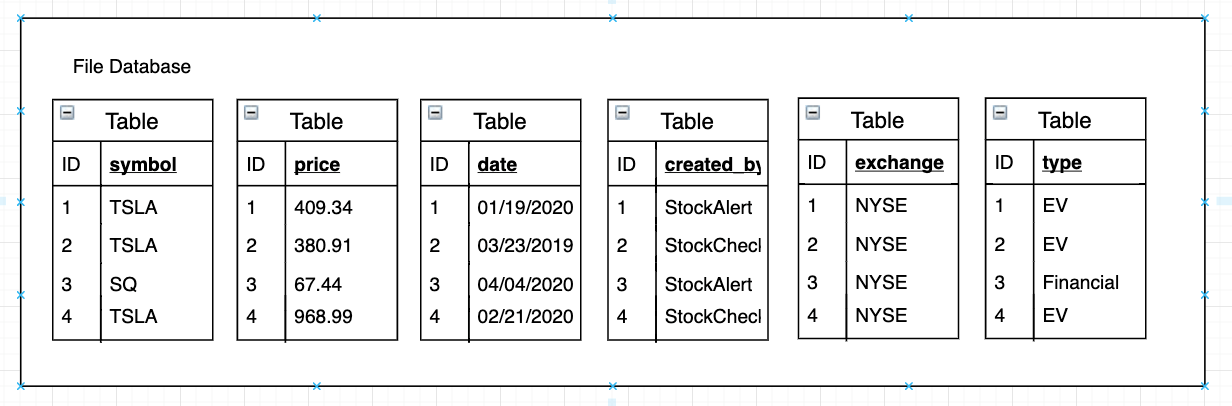
In the column representation, it lays out the data ‘column by column’. Assume every file is stored with its own database and when we write a stock quote to the columnar file, an ID is created and symbol, price, date, created_by, exchange, and type are broken up and written to these different tables within these files.
When we try to read, we only need to access 3 columns for the records instead of all the columns. So we read price, symbol, and date and ignore the rest of the columns.
For 1 billion records -> 100 Bytes each = 100GB x 3/6 at 100 MB/sec, it takes about 500 seconds. So, we are able to read through the records much faster.
In reality, these tables tend to be really big but the queries tend to access only a few attributes and that means the columnar representation can be much faster doing these scans, than the row-oriented representation.
In addition to the efficient scans, columnar representation compresses the data well. Each column can use a different scheme for compression. Since the values in a column tend to be similar to one another, compression can be very efficient. For example, if the table is sorted by stock symbol column, a very straightforward way of Run Length Encoding (RLE) can be used to compress this data.
TSLA, TSLA, TSLA, TSLA, TSLA, SQ, SQ, SQ, APPL, AAPL => TSLA x 5, SQ x 3, AAPL x 2
The above 10 values can be stored as TSLA times 3, SQ times 2, and AAPL times 2. If you think about a real-world scenario, this stock table might contain billions of values and we can represent this column as a few thousand stock quotes in the files. Note that we cannot apply the same trick for all the columns like a stock price for example.
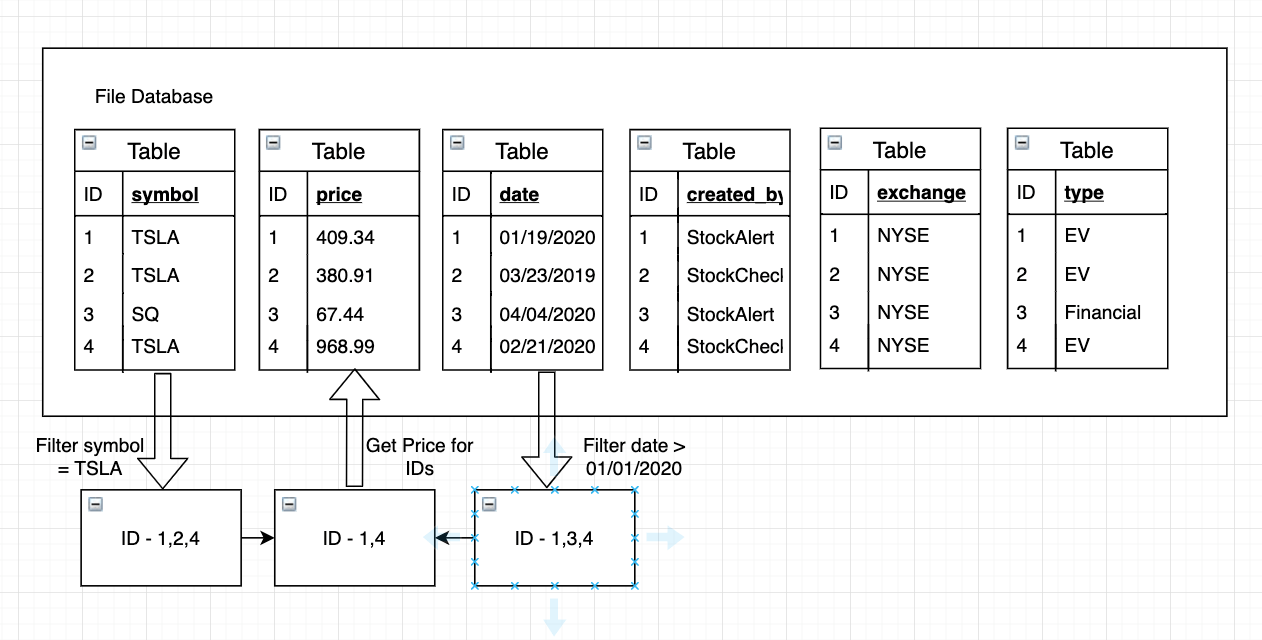
In the above example query, we are also doing a filter on symbol and date. So, we can simply look at the first table for stocks and the third table for the date, filter down to the common ROW IDs, and run a binary search(Row IDs are sorted) to pull out the price column values for these Row IDs. That’s Predicate Pushdown right there.
Columnar Data Formats
That’s why these columnar data formats are so powerful because we not only reduce the overhead in retrieving the columns we are looking for, but we also have the advantage of using these filtering restrictions and enhancements very effectively. Particularly when we are searching for a needle in a haystack kind of scenario and then being able to do these efficient scans over the data that we want to pull can save a lot of cost and time.
For a major ride services company, 30 days of ride service records on 1 TB data have resulted in the following using ORC columnar format compared to JSON representation.
- 64% compression
- 52x faster querying
Columnar Formats in Data Lakes
In a data lake, columnar formats can provide orders of magnitude reduction in storage costs and query run time for analytic queries.
Key Idea: Reduce the amount of data accessed per query by limiting the reading only to needed columns.