At the Data Platforms 2017 conference, we announced a new initiative on AIR (Alerts, Insights, and Recommendations). Insights and Recommendations are derived from data collected from all of the subsystems of a data engine. For example, the columns used in filter clauses in an SQL query are used to recommend partition or sort columns. In this blog, we will describe the infrastructure to collect data from Apache Hive, Apache Spark, and Presto clusters.
Data Sources for AIR
At a high level, Apache Spark, Apache Hive and Presto engines have the following subsystems:
- Optimizer
- Execution Engine
- Storage Layer
- Cluster Management: Unique to QDS which manages autoscaling, spot node allocation, and other features
- Account and Cluster Configuration: Information on users and clusters set up in an account
In this section, we will discuss interesting data that can be gathered from each subsystem.
Optimizer
The optimizer plans SQL queries and passes them on to the execution engine. The most interesting output is the ParseTree. ParseTree is a tree of operators representing the various operations on tables.
Stage-0 <-Reducer 6 [SIMPLE_EDGE] vectorized SHUFFLE [RS_84] PartitionCols:_col1 Filter Operator [FIL_83] (rows=479158034 width=88) predicate:_col2 BETWEEN 1 AND 5 Select Operator [SEL_82] (rows=958316068 width=88) Output:["_col0","_col1","_col2"] Group By Operator [GBY_81] (rows=958316068 width=88) Output:["_col0","_col1","_col2"],aggregations:["count(VALUE._col0)"],keys:KEY._col0, KEY._col1 <-Reducer 5 [SIMPLE_EDGE] <-Map 8 [BROADCAST_EDGE] vectorized BROADCAST [RS_72] PartitionCols:_col0 Select Operator [SEL_71] (rows=501 width=1544) Output:["_col0"] Filter Operator [FIL_70] (rows=501 width=1544) predicate:((s_county) IN ('Saginaw County', 'Sumner County', 'Appanoose County', 'Daviess County') and s_store_sk is not null) TableScan [TS_9] (rows=1002 width=1544) <-Map 9 [SIMPLE_EDGE] vectorized SHUFFLE [RS_80] PartitionCols:_col0 Select Operator [SEL_79] (rows=73049 width=988) Output:["_col0"] Filter Operator [FIL_78] (rows=73049 width=988) predicate:d_date_sk is not null TableScan [TS_12] (rows=73049 width=988) default.date_dim,date_dim,Tbl:COMPLETE,Col:NONE,Output:["d_date_sk"]The Parse Tree provides information on the operations performed on every column. For example, we can find out if a particular column is used in :
- Filter clauses — e.g. where created_date between 2017-01-01 and 2017-06-01
- Join clauses — e.g. primary_key = B.foreign_key
- Dimensions — e.g. group by state, zip_code
- Measures — e.g. sum(revenue)
The optimizer also uses the data model (definition of table, columns, partitions, and data types) and statistics of the data.
Engine
Engine performance is controlled by:
- Resources such as memory and CPU per task and in aggregate
- Data characteristics such as cardinality and sort of columns
Engine performance can be determined by metrics such as jobs.hive.tez.metric.spilledRecords and other similar metrics advertised by all engines. Another input is the SLA of the workloads. SLA can be specified manually or can be determined by the run time trends of the jobs.
Storage
The storage engine is in charge of reading data from the objects stored in public clouds. Since latency is very high, data is cached on local disks using systems such as Rubix. An important factor for performance is the eviction policy. A weighted cache replacement policy based on table and column usage data performs much better than standard policies such as LRU, LFU, and FIFO.
Cluster Management
The cluster management module controls the auto-scaling policies of the Hadoop, Presto, or Spark clusters. A treasure trove of data is available such as:
- Machine allocation time
- Machine boot-up time
- Node bootstrap time
- Machine shutdown time
- Spot Block and Notification metrics
Account & Cluster Configuration
Admins can set configuration options for every cluster in their account such as:
- Machine Type
- Billing policy (spot node etc)
- Max and Min Size
- Hadoop Configuration
- Hive Version and Configuration
- Spark Version and Configuration
- Presto Version and Configuration
These options are stored in a MySQL database in QDS. They are used to control the operations of a cluster. The database also stores the characteristics of a user such as groups and roles as well as important actions taken by every user.
QDS Data Warehouse
We have built a data warehouse that accepts and stores all the data from all the clusters managed by QDS. The data is stored in AWS S3. We use a combination of Apache Hive and Apache Spark for ETL, Presto for ad-hoc, Apache Spark for machine learning, and Apache Airflow for ETL workflows. These clusters are managed by QDS.
We chose to build a data warehouse on these technologies because of
- Variety of data – metrics, AST, time series
- The scale of the data – we collect granular data about every job and every operational event of every cluster
- Variety of analysis – the data will be used for reporting, machine-learning, and ad-hoc analysis
- Dog food our product
This section describes the data pipeline that captures data from different subsystems and writes it to the QDS data warehouse. The two main methods of importing data into the data warehouse are described below.
Apache Sqoop for MySQL Import
Account and cluster configuration is stored in a MySQL database. QDS provides DbImport to download the data. The main challenge is that a few of the tables such as cluster_nodes (all the machines in a cluster) are large, and so incremental extraction is required. Moreover, such tables are partitioned. DbImport has to be designed to handle these requirements. We will say more about incremental extraction from MySQL DB in a separate blog post.
MetricsD + Apache Kafka + StreamX
Data from the optimizer, execution engine, storage layer, and cluster manager is captured through a streaming platform. A high-level overview of the streaming platform using MetricsD, Apache Kafka, and StreamX is shown below:
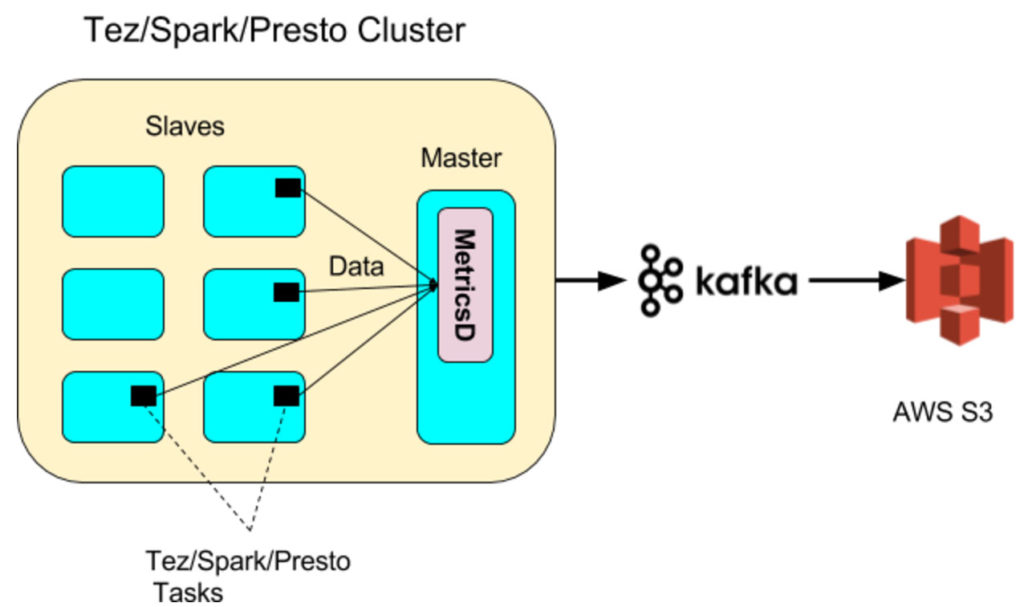
MetricsD is an internal service built to pre-process data at the source. It is a simple DropWizard application that runs on all machines in the QDS ControlPlane and the master node of Hive, Spark, and Presto clusters. It has the following goals:
- Add dimension data like account_id or cluster_id.
- Compress and encode data.
- Guarantee reliable and efficient delivery of any binary payload to the streaming platform.
It exposes a REST and Thrift API:
/event?dimension1=value1&&dimension2=value2&&..payload=<binary payload>
Any module can call the API and provide dimensions such as user_id along with the payload. It will also add common dimensions like account_id or cluster_id. For example, Tez tasks push job metrics to the MetricsD daemon running on the Master node.
MetricsD can accept any binary payload. JSON such as metrics from a Tez job and text blobs such as the AST from a Hive Parser are the most common types. The payload is compressed using a Snappy compressor. Lately, some teams are experimenting with MessagePack especially if the schema has stabilized. MetricsD provides a configurable pipeline to support different types of encoders and compressors based on the payload.
MetricsD pushes the data to an Apache Kafka cluster. We chose Apache Kafka based on current and future needs. Currently, Apache Kafka receives data for every SQL statement from the 100s of clusters managed by QDS. Very soon it will also receive event series data during cluster startup & shutdown, auto-scaling events, and task-level data. We expect to scale the Apache Kafka cluster to process these new events.
One of the consumers in the Apache Kafka cluster is StreamX. StreamX writes data to Hive tables hosted in AWS S3. The data is encoded to parquet and it is inserted into hourly partitions using the time-based partitioner. These tables are used by ETL pipelines that extract insights and recommendations and push them back to QDS. Users can then consume insights and recommendations through the QDS Portal.
Summary
In this blog post, we have described the infrastructure required to collect data from all the Hive, Spark, and Presto clusters that are managed by QDS. In the future, we will release more data-driven products built on the QDS Data Warehouse.