Co-authored by Jeffrey Ellin, Solutions Architect, Qubole.
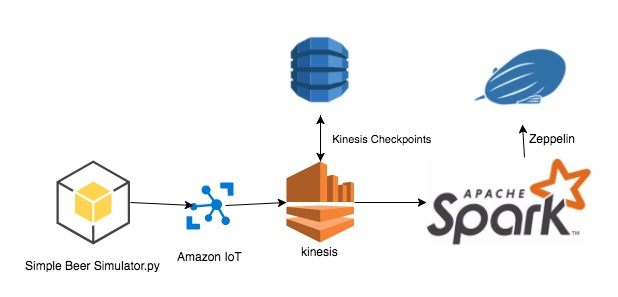
In our last post, we discussed setting up Amazon IoT, Kinesis and Qubole to build a streaming pipeline. In this post, we will show you how to visualize the data in realtime using Qubole Notebooks which are based on Apache Zeppelin.
Qubole Notebooks give data scientists an easy way to interact with data stored in cloud data stores such as Amazon S3, Microsoft Azure Blob Store, etc. and also provide an integration point for using visualization tools such as D3.js and Plotly via its Angular interpreter. In addition, Qubole Notebooks come with built-in visualizations that can be leveraged for quickly creating charts such as bar, pie, line graphs, etc.
Note: In order to follow along with this post, please make sure you have setup your environment and are able to run the demo from our last post — where we were outputting the data to the file system.
Spark Streaming
In this post, we will load the data into a data frame that can be rendered using Spark SQL. As data is received we will use Zeppelin’s run command to update the Qubole Notebook paragraph containing our visualization.
val unionStreams = ssc.union(kinesisStream)val sqlContext = new SQLContext(SparkContext.getOrCreate()) //Processing each RDD and storing it in temporary tableunionStreams.foreachRDD ((rdd: RDD[Array[Byte]], time: Time) => {val rowRDD = rdd.map(jstr => new String(jstr))val df = sqlContext.read.json(rowRDD)df.createOrReplaceTempView("realTimeTable")z.run("20170821-222346_757022702")})
Similar to our setup we will post sample data to Kinesis using the Simple Beer Simulator (SBS).
{"deviceParameter": "Sound", "deviceValue": 109, "deviceId": "SBS03", "dateTime": "2017-08-19 23:57:26"}
{"deviceParameter": "Temperature", "deviceValue": 35, "deviceId": "SBS04", "dateTime": "2017-08-19 23:57:27"}
{"deviceParameter": "Temperature", "deviceValue": 23, "deviceId": "SBS03", "dateTime": "2017-08-19 23:57:28"}
{"deviceParameter": "Humidity", "deviceValue": 86, "deviceId": "SBS01", "dateTime": "2017-08-19 23:57:29"}
Run SBS
docker run -ti sbsRun Notebook Paragraphs
The first time through we recommend running each paragraph step by step, one at a time. This way you can troubleshoot any issues before running all paragraphs of the Notebook from top to bottom.
Note: The first paragraph you run may take a bit longer because the Spark Interpreter for Zeppelin is lazily started the first time it is needed.
Import Dependencies
import com.amazonaws.regions.RegionUtilsimport com.amazonaws.services.kinesis.clientlibrary.lib.worker.InitialPositionInStreamimport org.apache.spark._import org.apache.spark.rdd.RDDimport org.apache.spark.sql.types.{StringType, StructField, StructType}import org.apache.spark.sql.{Row, SQLContext, SaveMode}import org.apache.spark.storage._import org.apache.spark.streaming._import org.apache.spark.streaming.kinesis._import org.json4s.jackson.JsonMethods.parseimport org.json4s.DefaultFormatsimport org.json4s.jackson.JsonMethods.parseimport org.json4s.DefaultFormatsimport org.apache.spark.sql.functions._
Set Variables
Make sure you’ve added valid AWS key and secret in the following code snippet.
val awsAccessKeyId = ""val awsSecretKey = ""val kinesisStreamName = "iot-stream"val kinesisEndpointUrl = "kinesis.us-east-1.amazonaws.com"val kinesisAppName = "SBSStreamingReader"val kinesisCheckpointIntervalSeconds = 1val batchIntervalSeconds = 60
Setup Streaming
The following function will be called each time new data arrives from the Kinesis stream.
val ssc = new StreamingContext(sc, Seconds(batchIntervalSeconds)) // Creata a Kinesis streamval kinesisStream = (0 until 1).map {i =>KinesisUtils.createStream( ssc, kinesisAppName, kinesisStreamName, kinesisEndpointUrl, RegionUtils.getRegionMetadata.getRegionByEndpoint(kinesisEndpointUrl) .getName(),InitialPositionInStream.LATEST,Seconds(kinesisCheckpointIntervalSeconds),StorageLevel.MEMORY_AND_DISK_SER_2,awsAccessKeyId, awsSecretKey )}val unionStreams =ssc.union(kinesisStream)val sqlContext = new SQLContext(SparkContext.getOrCreate()) //Processing each RDD and storing it in temporary tableunionStreams.foreachRDD ((rdd: RDD[Array[Byte]], time: Time) => {val rowRDD = rdd.map(jstr => new String(jstr))val df = sqlContext.read.json(rowRDD)df.createOrReplaceTempView("realTimeTable")z.run("20170821-222346_757022702")})
Execute
The following function will be called each time new data arrives from the Kinesis stream.
ssc.start()Visualize
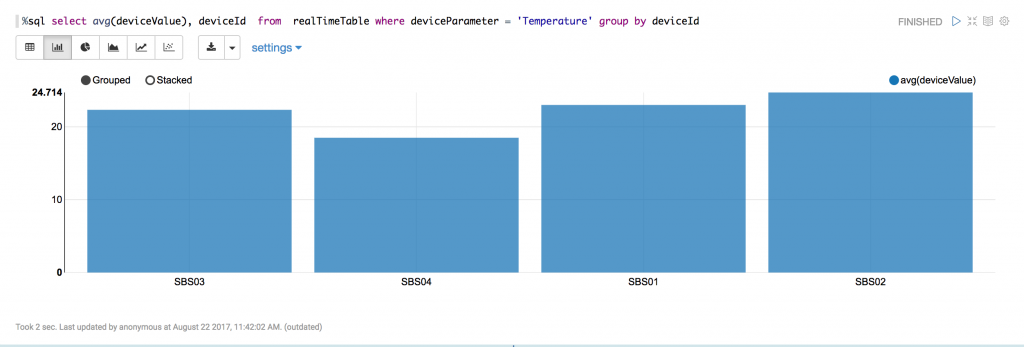
Run the following SQL in a new Notebook paragraph to display bar chart as shown.
Update
Write and execute z.run() statement to the streaming portion to force the graph to refresh each time a new event set is processed. Note: You can get the paragraph Id for the graph by selecting the settings icon and copying the value to the clipboard.
z.run("20170821-222346_757022702")In Summary
This post illustrates how you can visualize (IoT) data as it is being retrieved by Spark Streaming in Qubole. Note that with this setup you can only query the most recent data from the last batch interval. In a real world scenario, you could publish the streaming data into an elastic cache backed by Elasticsearch or key-value store / NoSQL database such as Redis and then query and visualize your chart over the desired time window.
The complete code can be found at — https://github.com/jeffellin/spark-kinesis/tree/qubole-part-2