This blog post explores how queries can be sped up by keeping optimized copies of the data. First, we will explore the techniques and benchmark some sample results. Later, we talk about how one can use Quark (which we detailed in a previous post) to easily implement these performance optimizations in a Big Data analytics stack.
Setup
We will cover three techniques:
- Sorted Tables
- Narrow Tables
- Denormalized Tables
All performance numbers were obtained on the following setup:
- TPC-DS Scale 1000. Store Sales Tables has ~3 billion rows.
- Presto SQL engine running on 4-node r3.xlarge instances.
- Data stored in ORC format.
- None of the tables were partitioned.
- The timings are the best of three runs.
- The techniques listed below are applicable regardless of the SQL engine or data format.
Sort Tables
The access path of columns that are used in Filter, Join, and Group By clauses has a substantial effect on the run time of a query. The best practice is to partition data on these columns which will help the SQL engine parallelize the execution of the query.
However, there are situations when it is not possible to partition these columns. For example, consider the store_sales table in TPC-DS. The first step is to partition on ss_sold_date_sk since it is used in the filter and join clauses. The next step is to focus ss_item_sk since it is used in join clauses. However, it is not possible to partition on ss_item_sk since it has too many unique values.
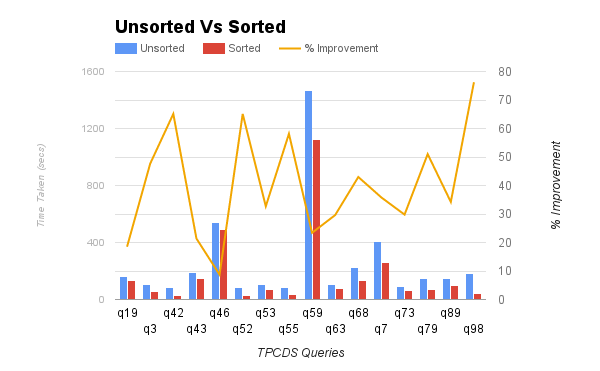
Instead, we can sort the data on ss_item_sk and store it in a format like ORC or Parquet. This allows the readers to use binary search and eliminate blocks. The graph below shows the performance improvement in some of the queries in TPCDS that filter and join on ss_sold_date_sk and ss_item_sk. In this benchmark, we sorted by ss_sold_date_sk, ss_item_sk since the data is not partitioned. Using the sorted tables increased the performance by as much as 78%.
Narrow Tables
OLAP queries do not access all columns in a table. We analyzed the workload of one of Qubole’s largest customers. The customer submitted more than 130,000 queries in 2 months. Below is a sample of our findings, along with anonymized table names:
Table Total Columns Columns Referenced Important Fact Table 265 74 Important Dim Table 33 10
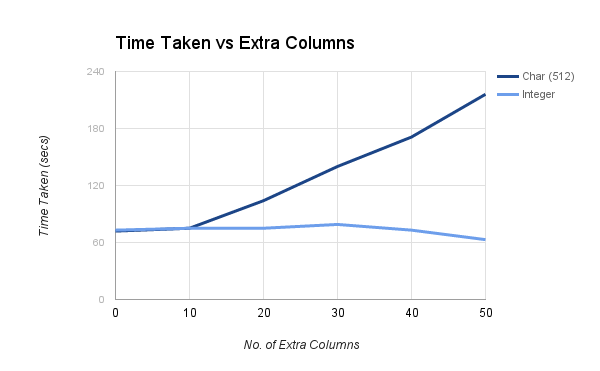
If the analysts had access to narrow versions of these tables, then each query would require much less I/O. The graph below shows the effect of extra columns in a table. Extra int columns do not have a detrimental effect on performance. However, extra [var][char|binary] columns do affect the performance of a query. So if a table contains such unused columns, it is helpful to keep a copy of the data with just the popular columns in a table.
Denormalized Tables
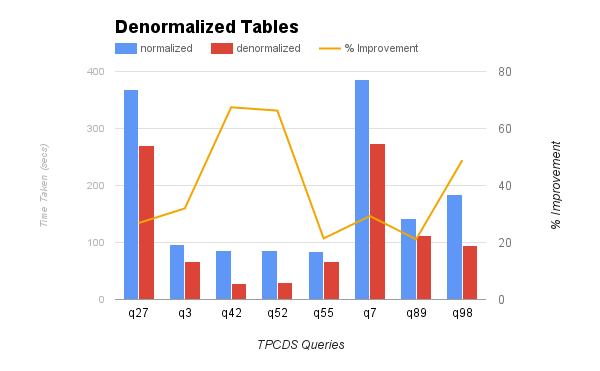
In TPCDS queries, store_sales and items table are joined in a few queries. If there is a copy of the joined result of these two tables, then each of the queries requires one less stage. The graph below shows the performance improvement of queries that read the denormalized table of store_sales and items. The improvement in query performance by using denormalized tables is up to 66%.
Practicalities
These techniques are not new and have been known for a long time in the database world. Two factors make it hard to use these techniques in the Hadoop ecosystem.
First of all, a survey of the popular open-source (Presto, Apache Hive, and Spark SQL) and commercial analytic databases (Amazon Redshift, HP Vertica, EMC Greenplum) showed that none of them supported materialized views. Therefore, the data team has to manually communicate the existence of the optimized copies of the data to the analysts. In large organizations, communication and documentation are too high an overhead to implement these techniques successfully.
Second, it is very common to use more than one technology to improve performance and accessibility. For example, base tables may be hosted in S3 and managed through Apache Hive, and materialized views may be stored in a data warehouse like Redshift.
Quark
Quark solves both the problems mentioned in the previous section. Data architects can define materialized views through DDL statements. Quark will reroute queries submitted by analysts to materialized views using a cost-based optimizer. In the future, materialized view definitions stored in Quark can be used to automate ETL for refreshing materialized views.
Materialized Views
Quark requires materialized views to be stored in relational tables. Quark supports DDL statements to register materialized views. Let us consider Narrow Tables to illustrate the steps required in Quark. The example assumes that the base tables, as well as the materialized views, are stored in HDFS or Object Store and accessed through Apache Hive. If you choose other SQL engines, then a few modifications may be required.
Create Table
The first step is to create a table in Hive.
create table narrow_store_sales_3m as
  select ss_sold_date_sk, ss_item_sk, ss_ext_sales_price
  from store_sales where ss_sold_date_sk >= 2457479 #Julian Day for Apr 1 2016
Create a Materialized View
create view narrow_store_sales view
  stored in narrow_store_sales_3m
as select ss_sold_date_sk, ss_item_sk, ss_ext_sales_price
  from store_sales where ss_sold_date_sk >= 2457479
After the table and the materialized view is set up, queries like Q3 in TPCDS benchmark will be re-routed to the materialized view. The materialized view can be refreshed by inserting new data into narrow_store_sales_3m and altering the definition of the materialized view with an ALTER VIEW command.
Summary
In this blog post, we explored the utility of materialized views in big data analysis and how Quark can help with deploying these techniques to your data team. Quark is open source and can be installed directly into on-premises setups. It is also available on the Qubole Data Service platform. We encourage you to use Quark to improve the performance and resource utilization of your big data stack.