The proliferation of Cloud for Big Data workloads has provided many benefits and has also opened up new areas of optimization. But Data teams often do not have the right information and as a result, there are several missed opportunities to:
- Improve Productivity
- Improve Performance
- Reduce resources consumed
- Reduce resource cost
To solve this problem, we built an intelligence service that collects data across the stack, analyzes, and provides insights and recommendations to all types of personas- Data Consumers (Analysts, Data Scientists, Data Engineers) and Data Service Providers (Admins) in an organization.
At Data Platforms 2017 Conference, we announced early access of Data Discovery and Data Model Intelligence. Today we are proud to announce that the same service AIR (Alerts, Insights, Recommendations) is now generally available.
Data Discovery for Data Consumers
Analysts spend most of their time finding the right data for the business problem they are trying to solve. The key to increasing their productivity lies in increasing agility and democratizing analytics by making it truly self-service. While there are many ways to provide this, Data Discovery helps analysts get the information about their data model intelligently and intuitively.
Intuitively through,
- Autosuggestion and completion
- Usage-Based ranking Collects usage metrics from all users and sorts suggestions intelligently based on top usage
- Context-Aware Suggestions knows when to suggest which object (Tables, Columns, Joins, and Filters)
- Search and discovery
- Search for all available column names(filter all tables which contain a column) or table names (filter all tables which has the search word and browse through the available columns).
- Top-down analysis provides insights into how other users query a particular table making it easy to use tables that are unfamiliar.
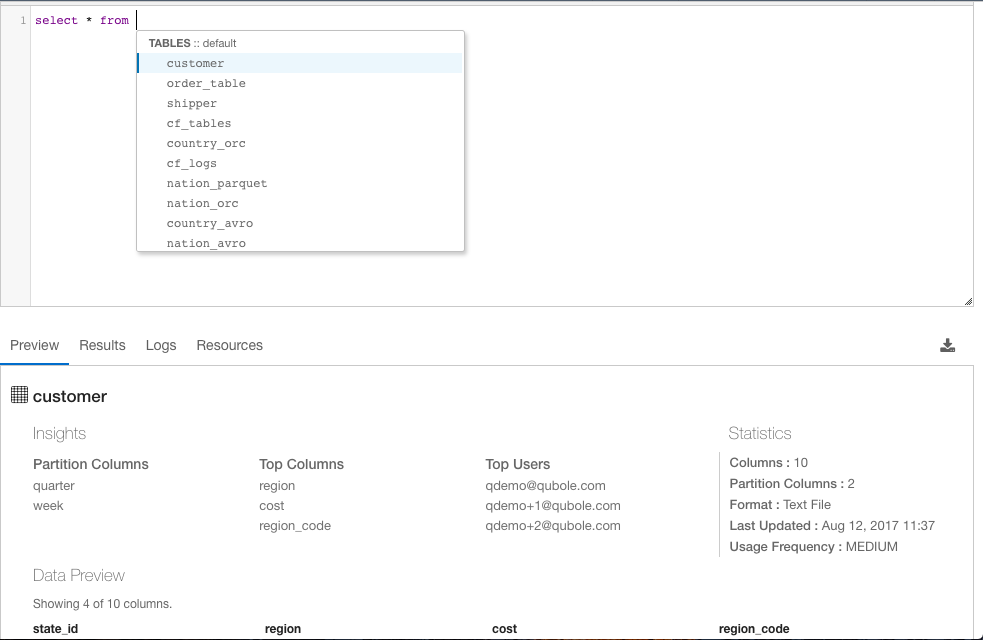
Intelligently through,
- Usage Insights provide insights into the most used columns, tables, joins, filters, and the most frequent users enabling analysts to be more context-aware, to learn from other expert users, and to ramp up on new data sets more efficiently.
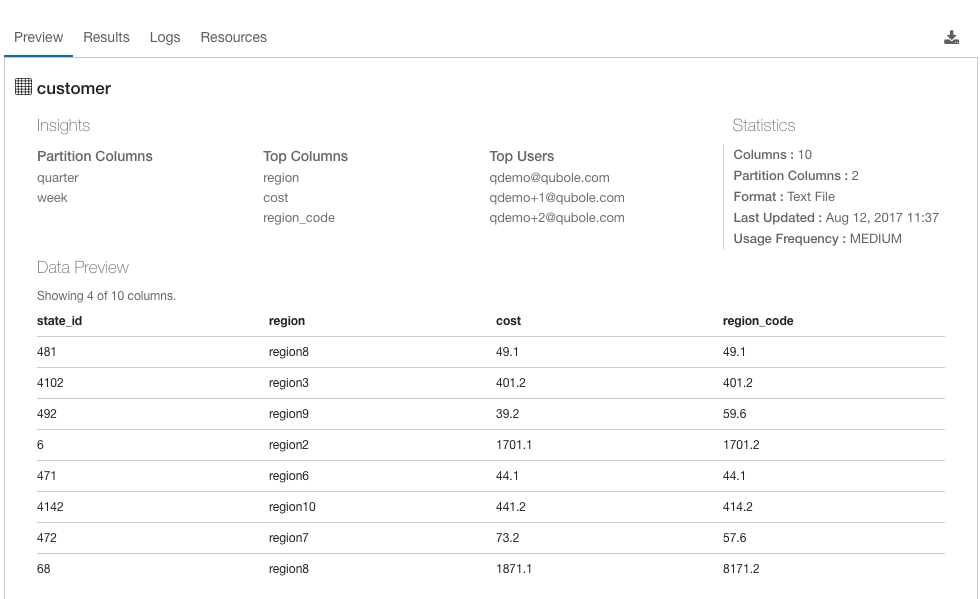
- Statistics provide a high-level summary of a particular table or column.
- Data Preview provides sample data for a particular table or column giving the analyst an overview of the data that they are going to query.
- Data Profile provides a summary of the data itself. A summary such as a column cardinality, number of rows with unique values for a particular column, # of nulls or zeros for a particular column.
Data Model Intelligence for Data Service Providers
Data Admins, on the other hand, face a different set of problems. In addition to productivity, cost and performance of the infrastructure play a big role. One important factor is Data Model Design. Relevant questions on data model design are:
- Do I have the right data to make intelligent decisions?
- Am I optimizing the Data Model efficiently? What is the right strategy given my specific setup?
In order to solve this problem, we built Data Model Usage Intelligence which provides Insights (for ‘All Tables’ as well as ‘Hot Tables’) and Recommendations to help the Data Services team identify opportunities for optimizing the data model (partition, sorting, changing the data format, etc).
AIR infrastructure extracts insights and recommendations based on usage metrics such as:
Data Model Insights
- Most frequently used tables, columns, and partitions.
- Top users of specific tables, columns, and partitions. These users may be the subject matter experts on the data in these tables.
- Distribution of I/O or compute resource consumed across users, tables, and commands.
Qubole Data Service (QDS) can report on all tables, or hot tables specifically.
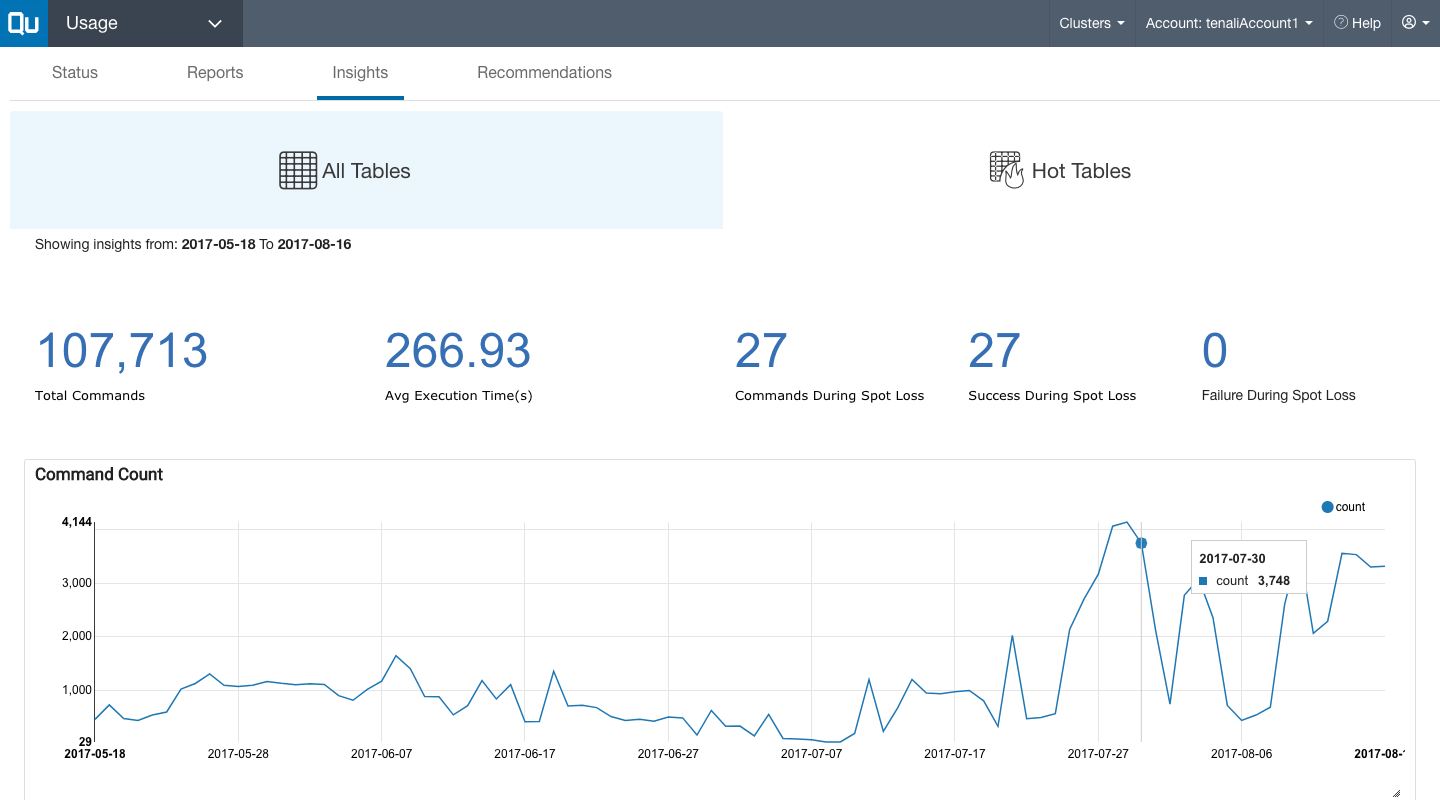
All Tables
This view:
- Summarizes total commands and average execution time.
- Shows a graph of the volume of commands, per day.
- Shows a graph of total execution time, in seconds, per day.
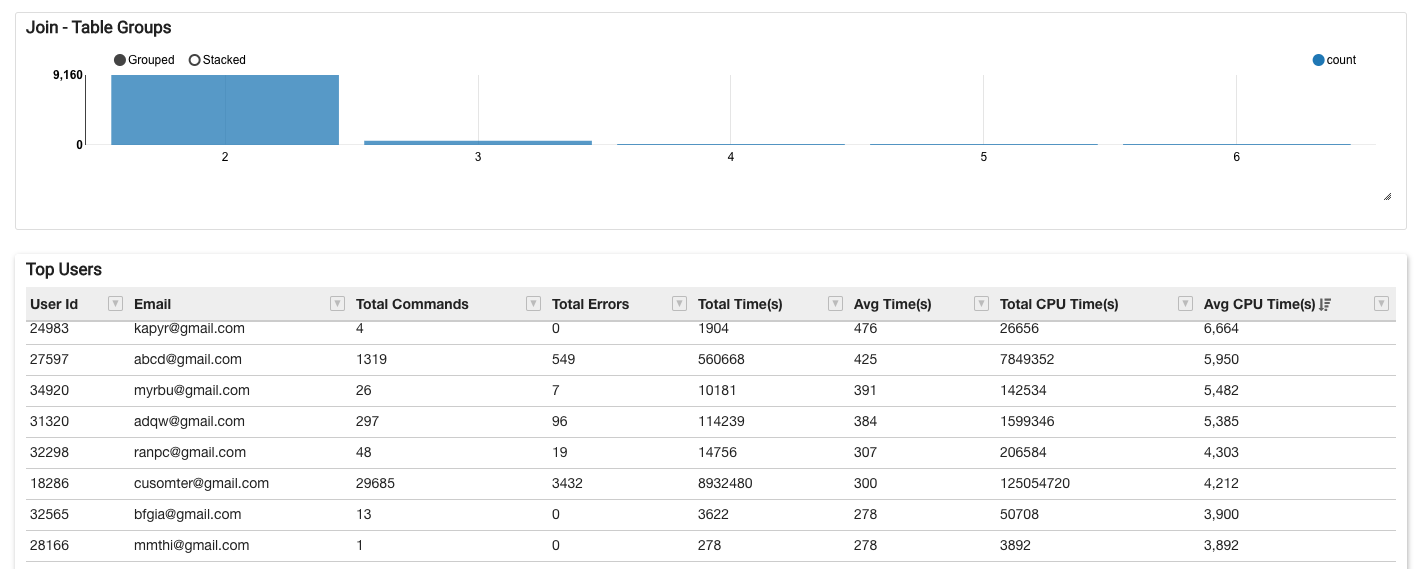
- Shows a histogram of the number of tables that were joined together.
- Shows a leaderboard of the top users in terms of query count, with other data such as total commands submitted by each user, total errors, and total execution time (for all the queries submitted by this user).
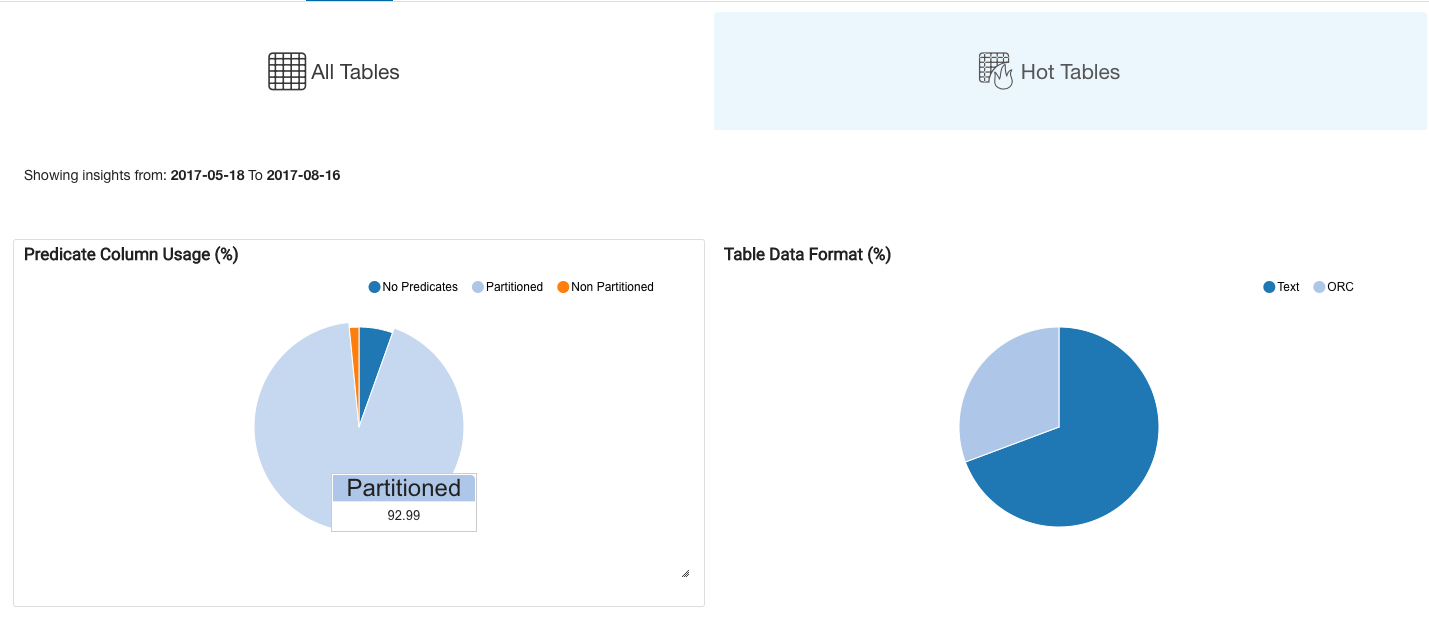
Hot Tables
This view provides:
- A pie chart showing the percentage of commands using hot tables that:
- Use as a filter the column on which the table is partitioned
- Use as a filter a column on which a table is not partitioned
- Do not use any filter
- A high percentage in the first category indicates that the table is correctly partitioned; a high percentage in the second category may mean that the table needs to be re-partitioned.
- A pie chart showing the percentage of commands using hot tables that are in:
- Columnar format (ORC, Avro, Parquet)
- Non-columnar format
- This highlights the overall efficiency of the data models and helps to determine if the data models have to be converted into a columnar format to improve query performance and reduce the overall data scans.
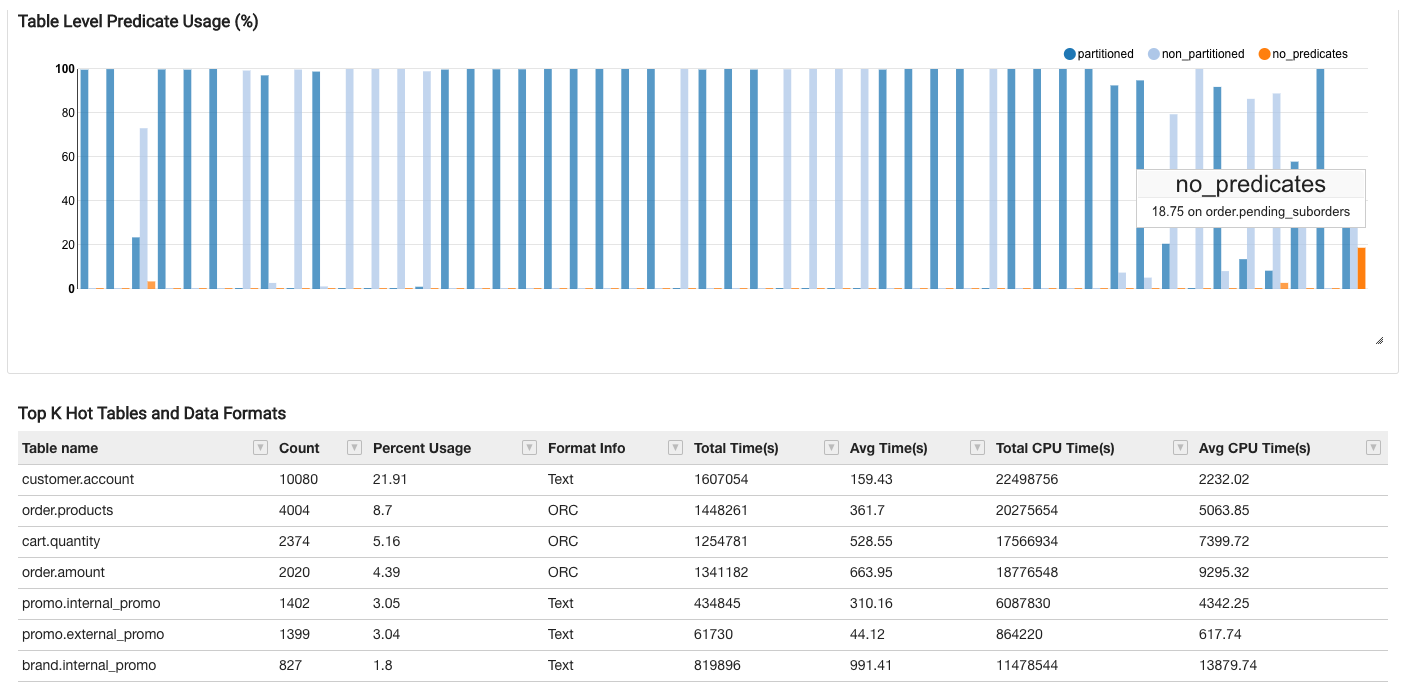
- A graph showing the above analysis broken out by individual hot tables so that admins can decide which table to prioritize for re-partitioning.
- A table showing the most used hot tables and their relevant data formats.
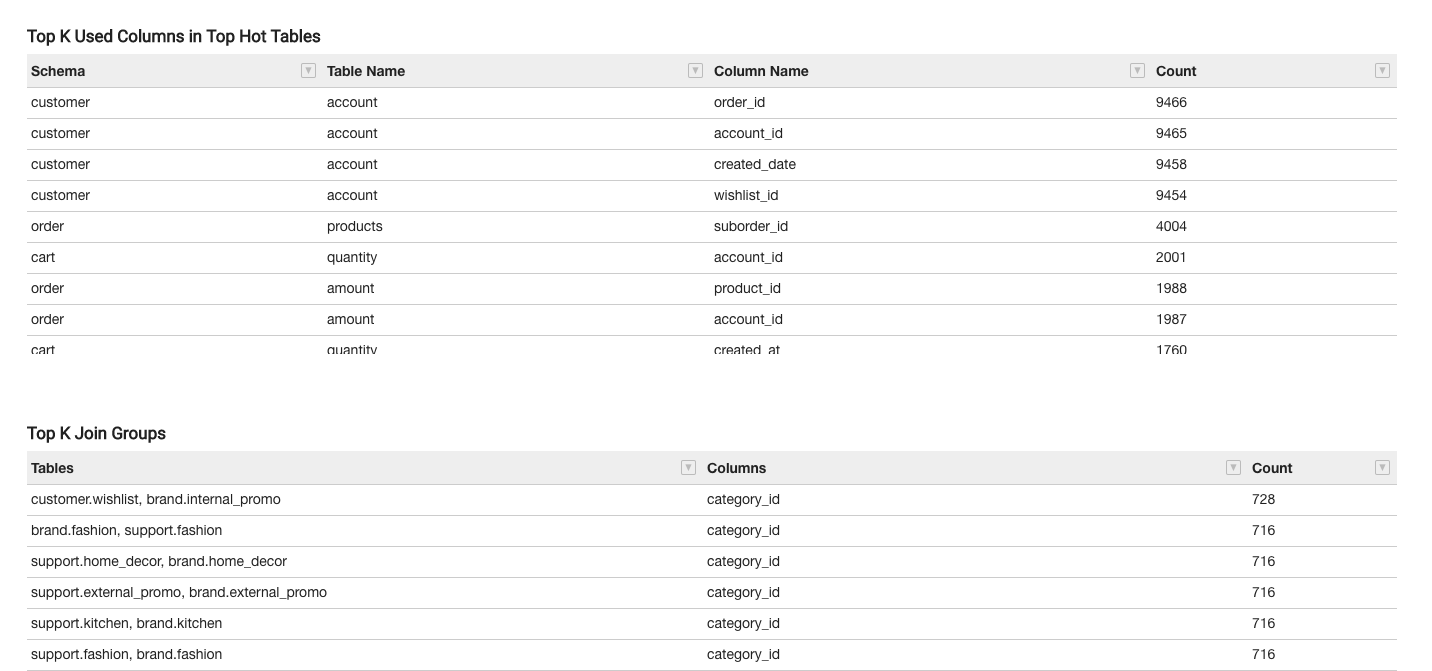
- A table showing the most-used columns for each hot table in ascending order.
- A table showing the top used Join groups and the count of how many times have they been used in queries.
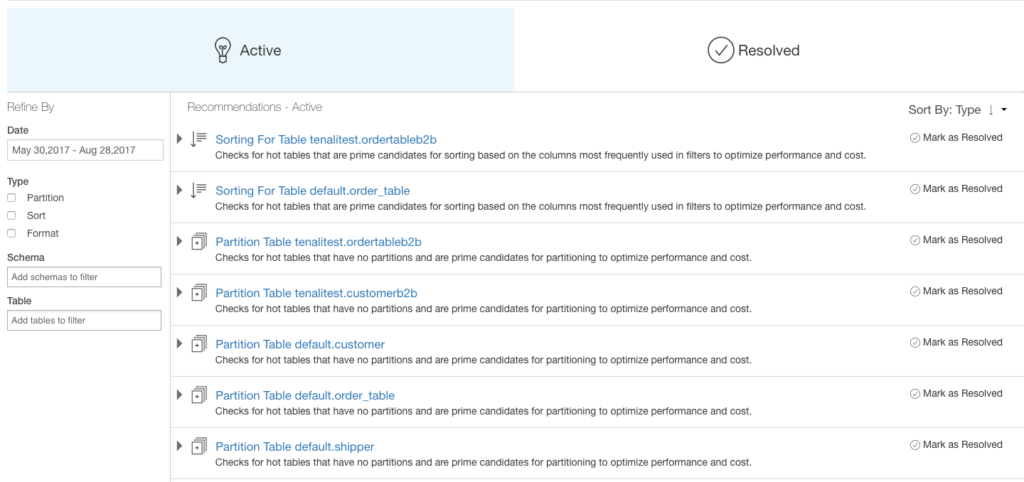
These insights drive recommendations to improve usability, performance, and cost such as:
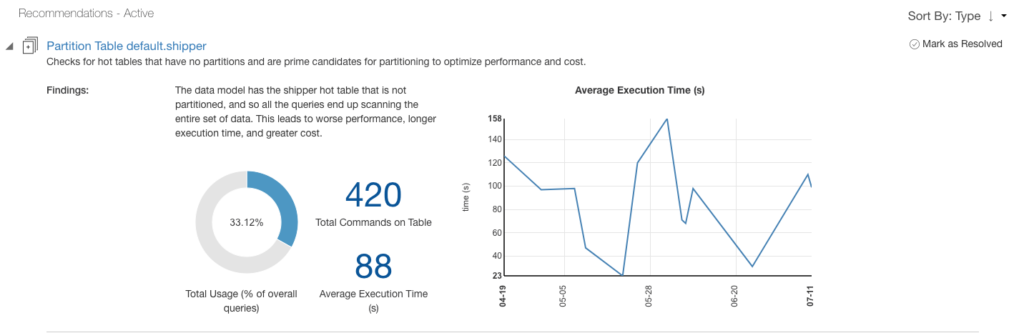
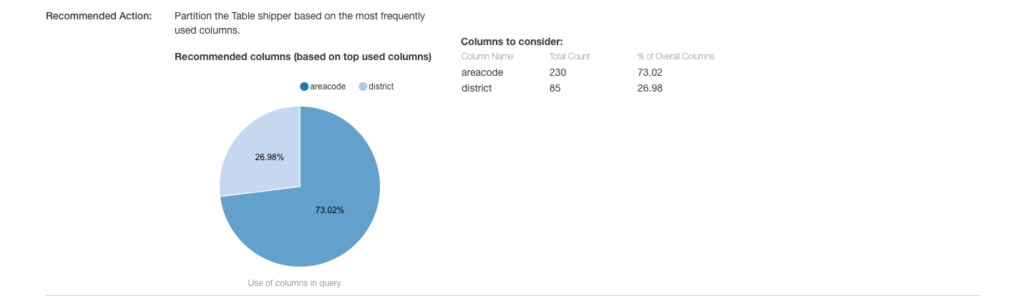
Data Model Recommendations
- Identify the right partition column (based on the top used predicate) for a specific table.
- Identify tables that are not in columnar format and recommend the right data format (ORC, Parquet).
- Recommend the right list of columns (based on top used predicate) based on which a particular table can be sorted.
But this is barely the tip of the iceberg. What else is possible with this intelligence infrastructure? Can we expand this to other areas of the QDS technology stack? Can this help analyze the workloads and answer the below questions?
- Can the user reduce cost for the same performance? Cost can be saved by using smaller machines or smaller clusters.
- At what cost can a workload run faster?
- Is my AWS Spot Node policy effective?
- Will a Heterogeneous cluster help me?
In Summary
We’re committed to building data-driven products that help organizations increase the productivity of data team members and performance while reducing the TCO of big data initiatives. In this blog post, we’ve introduced two such new products that are built on an infrastructure that collects data from Hive, Spark, Presto, and Hadoop clusters to provide Alerts, Recommendations, and Insights (AIR).
We are proud to announce that AIR is now generally available and will be rolled out to existing customers over the next couple of weeks. For more information and questions, please contact your Qubole account team or contact us at [email protected].
If you’d like to try these features and give us your feedback, sign-up below and email us your [email protected].