UPDATE: Qubole’s Spark tuning tool is now open source and named Sparklens. To contribute, check out the source code from https://github.com/qubole/sparklens.To analyze your spark applications with Sparklens, just add the following additional configuration parameters to spark-submit or spark-shell:
 --packages qubole:sparklens:0.1.2-s_2.11
 --conf spark.extraListeners=com.qubole.sparklens.QuboleJobListener
Apache Spark has proven to be a great engine for processing large datasets of terabytes or greater. Due to fault-tolerant data processing in massive distributed and parallelized setups, its applications fit in everything from machine learning and advanced analytics, to ETL batch transformations at scale. However, one of the pitfalls of Spark is that it is a beast to configure and wrangle. The massive amount of configurations needed to run different workloads at scale can make it unstable if done improperly.
We now make this process more self-service with a managed auto-scaling solution for running Spark in your preferred cloud infrastructures. Towards this mission, we have built a tool, based on the Spark listener framework, that provides insights about a given Spark application by looking at just one run of the application.
One of the common problems users face when configuring and running spark applications is deciding the number of executors or the number of cores they should use for their application. Usually, this process is done with trial and error, which takes time and requires running clusters beyond normal usage (read wasted resources). Moreover, it doesn’t tell us where to look for further improvements. Enter Qubole’s Spark Tuning Tool for optimizing Spark jobs in production.
After it has seen one run of the application, the tool will tell us:
- If the application will run faster with more cores. And if so, how fast.
- If we can save compute cost by running it with fewer cores without much increase in wall clock time.
- The absolute minimum time this application will take even if we give it infinite executors.
- How to take the application time below this minimum.
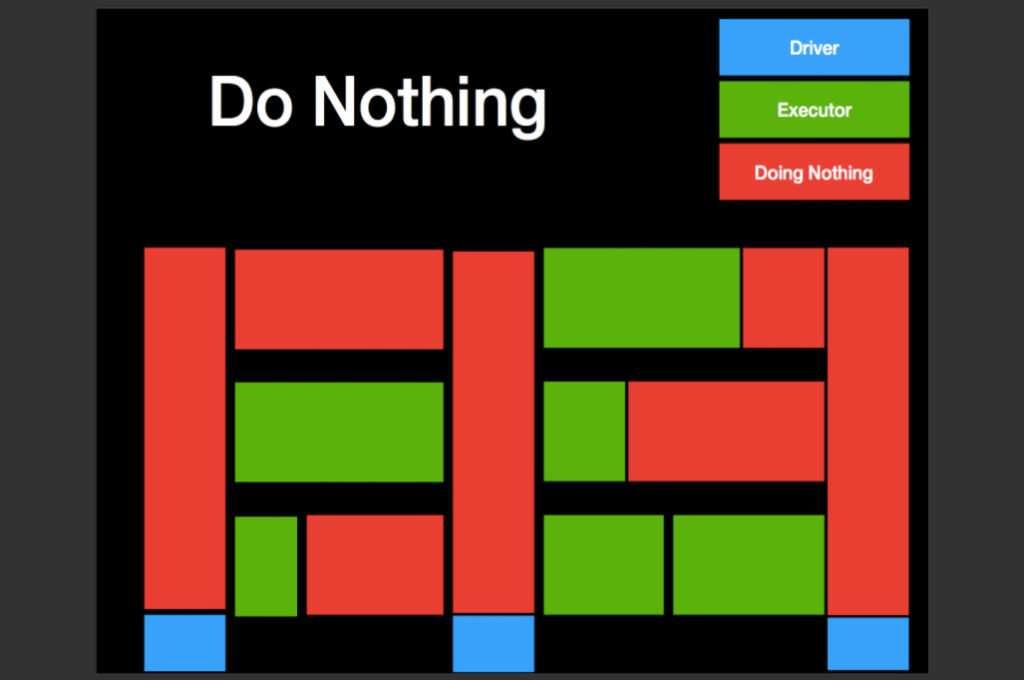
Many Spark applications do nothing in many of the executors and keep doing nothing for a long time. The image above shows the timeline of a spark application. The x-axis is time and on the y-axis we have resources. Specifically, this image shows three executors with one core each. The blue and green regions represent resources being actively used. The red region represents no useful work being done by resources. This “do nothing” happens because of three reasons:
Heavy Processing in the Driver
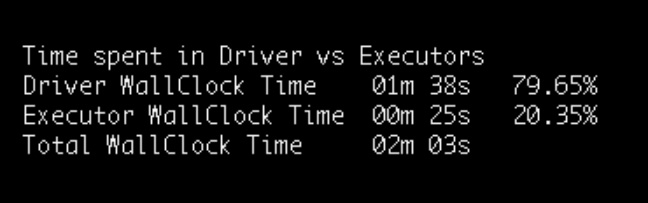
The first sub-optimal thing that users sometimes do is to structure their Spark application to do most of the processing in the driver. In some cases, it is not the user code, but some other components like Hive client loading tables that result in driver-heavy computation. From the wall clock perspective execution of spark, the application can be broken into distinct phases. Each of these phases is either executed on the driver or on the executors. The main takeaway is that when we are in the driver phase, none of the executors are doing any useful work. So if you have 100 executors and the driver gets busy for 1 minute, the effective compute resource wasted is 100 minutes, 1 minute of each executor. The very first metric emitted by our Tuning Tool is the percentage of wall clock time spent in the driver. The implication is that by moving processing from driver to executors, we can make the application scalable on large clusters.
Following are a few common operations done on the driver:
- File listing & split computation. In general, it is very slow on S3. At Qubole, we have done some optimizations to make this faster. See Part 1 and Part 2 for details on these optimizations.
- Loading of hive tables from Spark happens in the driver. This works very well on HDFS, but on S3 it is painfully slow. At Qubole, we have made significant enhancements to make writing to hive tables from Spark on S3 as performant and reliable as HDFS.
Now there are other things that we can’t automatically optimize. This includes things like user code calling df.collect to get all data into the driver and then working in the driver. Sometimes these things are hidden and not very obvious. For example, Spark DataFrames can be converted to Pandas DataFrames and vice versa. The issue of course is that Pandas DataFrame is processed only on the driver, whereas Spark DataFrames is processed on Executors and hence scalable. Qubole’s Spark Tuning Tool helps in making these unintended mistakes obvious.
Executor Side Utilization
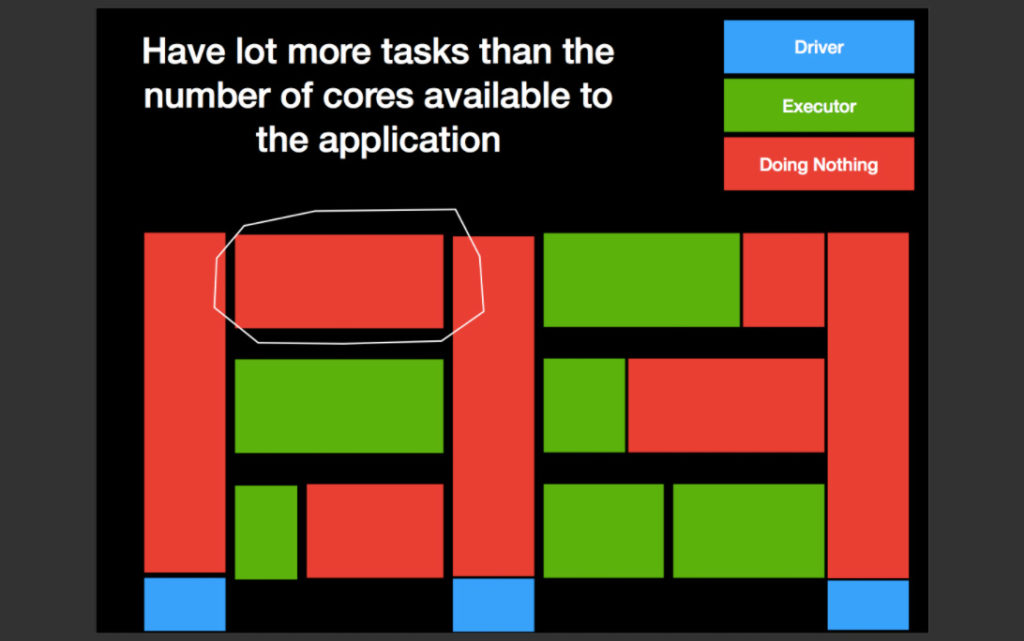
The second source of inefficiencies in the Spark application comes from wasted CPU resources on the executor side. There are multiple reasons for these inefficiencies, but it is pointless to start investigating them before fixing the issues with mostly driver-only computation. The executor utilization metric by a Spark application captures the essence of this inefficiency. Two common reasons for the under-utilization of executors are:
- Not having enough tasks (i.e fewer tasks than the number of cores available to the application)
- Having skewed tasks such that some tasks finish very fast, whereas others keep on running for a long time
It is easy to see why the first one is a problem. The second one is an issue because of how Spark schedules stages. When a child stage depends on some set of parent stages, the child stage is not scheduled until all tasks of all parent stages are complete. Hence it is not the average runtime of the task which determines the total running time, but the largest and the slowest task of the parent stages that determines the runtime of the application.
Predicting min, max, and ideal wall clock time
Using the detailed data from the Spark event listener, Qubole Spark Tuning Tool calculates the following:
- How much time the application will take when running on just one executor
- How much time the application will take when running with infinite executors
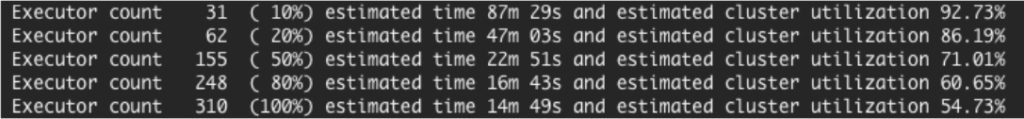
Together these two numbers give us the range for the application wall clock time and how close or far we are from these. Since infinite executors cost an infinite amount of money, we get a lower bound on how fast we can make the application run by just playing with the number of executors. The next level of investigation can be guided by these boundary conditions as reference checks. The purpose of this exercise is to make the ROI of the additional executor extremely obvious. The tool actually calculates wall clock times for different executor counts, not just the two extremes, to predict the point after which adding executors is pointless.
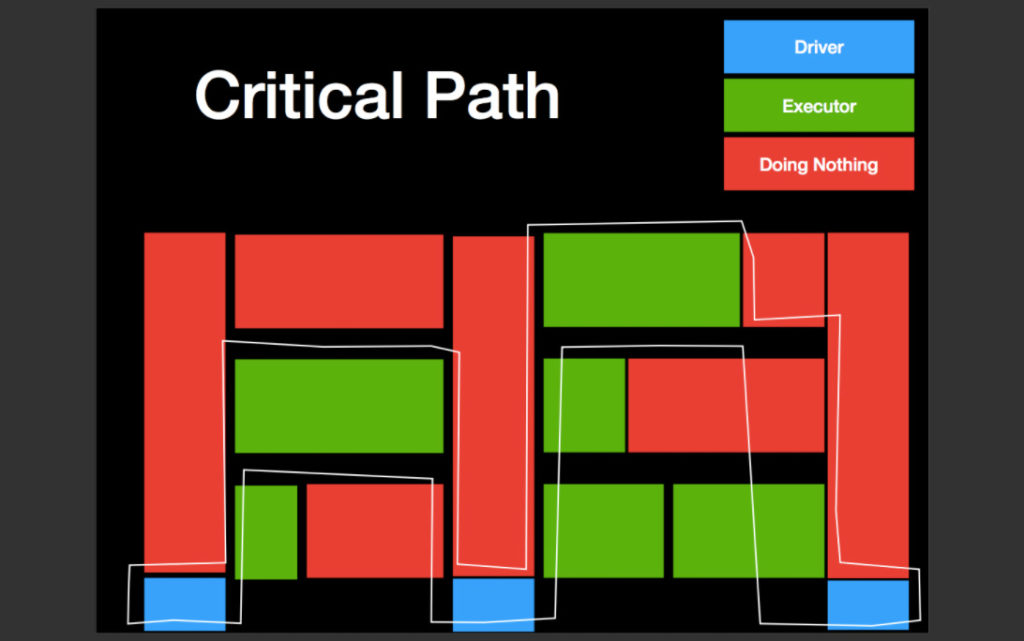
It is easy to draw parallels between this tool and scheduling theory in general. Specifically, the notion of the critical path of DAG of tasks is fairly researched. The point of the difference stems from the fact the scheduling theory takes task sizes and a number of tasks as given, whereas, with something as flexible as Spark, it is possible to construct tasks by carefully making configuration and code changes to produce tasks that have better scheduling characteristics.
How can we do better? Digging Deeper
Sometimes the boundary conditions produced in the previous step are not good enough. One of the other metrics published by the tool is the wall clock time for the “ideal” application. The ideal application is one that runs at 100% executor utilization. This number sets the next level target to drive application tuning towards the “ideal” application. If you are a manager of a team writing Spark applications, having a regular look at these statistics will help you understand how much money is left on the table by not optimizing these applications. It will help you take the correct side of the tradeoff between spending developer time optimizing applications vs spending money on compute bills.
The key characteristics to figure out are per-stage tasks (do we have enough of them) and per-stage skew (are the tasks uniform or skewed). Then, depending upon if it is worth tuning further, spending time to fix these problems. As discussed earlier, Spark moves to the next stage only when all tasks in a stage are over. Thus, one straggler task can hold up all of the resources in a wasteful way, until this slowest task completes. Instead of fixing skew issues with all of the stages, the Tuning Tool will point you to the stages which occupy most of the wall clock time. If 50% of the time is spent in one stage, we can focus on this one instead of worrying about all stages of the job.
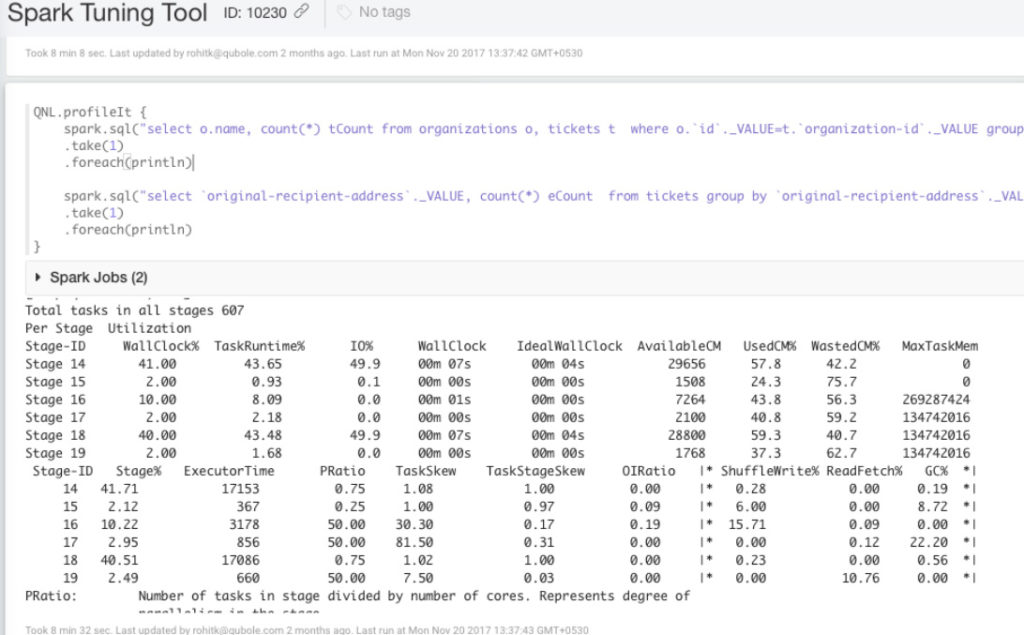
Four important metrics printed per stage by the tool are:
- PRatio: parallelism in the stage. Higher is better.
- TaskSkew: skew in the stage, specifically ratio of largest to medial task times. Lower is better
- StageSkew: ratio of the largest task to total stage time. Lower is better.
- OIRatio: output to input ratio in the stage. Are we creating too much temporary output?
Depending upon the values, we can take different actions, like ensuring enough parallelism, dealing with skew, making modifications to Spark applications to produce less temporary data, or if nothing else, trading execution time for money and running the job with fewer executors to have better cluster utilization.
Qubole Spark Tuning Tool works with Notebooks also. Instead of just profiling your Spark applications, you can use it in your development phase by profiling each fragment of code piece by piece. It works with both Python and Scala.
We have just started on this path of deconstructing the Spark application tuning. In this first version, we looked mostly at optimizing the Spark application with executor cores and wall clock times as the key evaluation criteria. Other variables like executor JVM heap size and internal memory allocation within Spark were not explored. We will be taking these up in the next version of the tool. Keep watching this space.
To test out the Spark Tuning tool yourself on your data, please sign-up through www.qubole.com to create your free account. Qubole Data Service (QDS) Business Edition is available at no cost, but usage is limited to 10,000 Qubole Compute Unit Hours (QCUH) per month (a $1000 value). Each QDS account can utilize any number of cloud-optimized data engines; including Spark, Hadoop, Hive, and Presto to power queries. To use QDS it is very straightforward to get started, and you will not have to migrate any of your data from your account in S3 or other AWS data repositories before processing workloads.
If you have an existing Qubole account, please reach out to your Qubole Representative or [email protected] to get access to this tool and start your journey toward building truly scalable Spark applications. May your Spark applications scale forever and ever and utilize all the CPU you have paid for – happy profiling!