Qubole has provided Datadog as an integrated monitoring service for its clusters, including Presto clusters. This brings many improvements compared to the “old approach” for monitoring Presto query performance and resource utilization.
The resulting benefits include much greater visibility through comprehensive and configurable metrics; ease of use via improved monitoring capabilities; and significant time savings by eliminating troubleshooting of bugs. Let’s contrast the old and new approaches in detail.
Datadog monitoring in Presto – old approach:
- Use JMX connector to publish metrics
- Run a daemon that issues queries to the JMX connector periodically to get these metrics and publish them to dogstatsd
Since Presto on Qubole already exposes a large number of metrics using JMX, we added a daemon that runs in the cluster coordinator. The daemon issues query on system/JMX catalog tables and then sends these metrics (query results) to the dogstatsd server using java-dogstatsd-client.

Some of the drawbacks of this approach are:
- Hard to debug which metrics/values are being sent in real-time
- Difficult to add new metrics, as the only way to collect custom metrics is through code changes to fire new queries
Datadog monitoring in Presto – New approach:
Using Datadog agent in Presto
- Use the Datadog-agent to collect and send metrics. The agent comes with JMX integration, which collects the metrics using JMXFetch and sends them to Datadog using the dogstatsd server running on the agent.

This approach overcomes the drawbacks of the previous approach:
- Automated generation and collection of metrics: Presto metrics become available organically when users run queries. These metrics are automatically collected by the Datadog-agent, making the process more efficient and simpler
- Easier to debug and maintain: Datadog-agent comes with JMXFetch which makes it very easy to monitor in real-time which metrics are sent and the values
- Configurable metrics: This approach provides an easy way to add new metrics without making any code changes to collect these metrics
To configure Datadog monitoring on a Presto cluster, refer to the respective Qubole documentation. Enabling Datadog on a Presto cluster on Qubole will create a default dashboard (Account <account owner> Cluster <label> (<cluster ID>)) with default metrics and alerts:
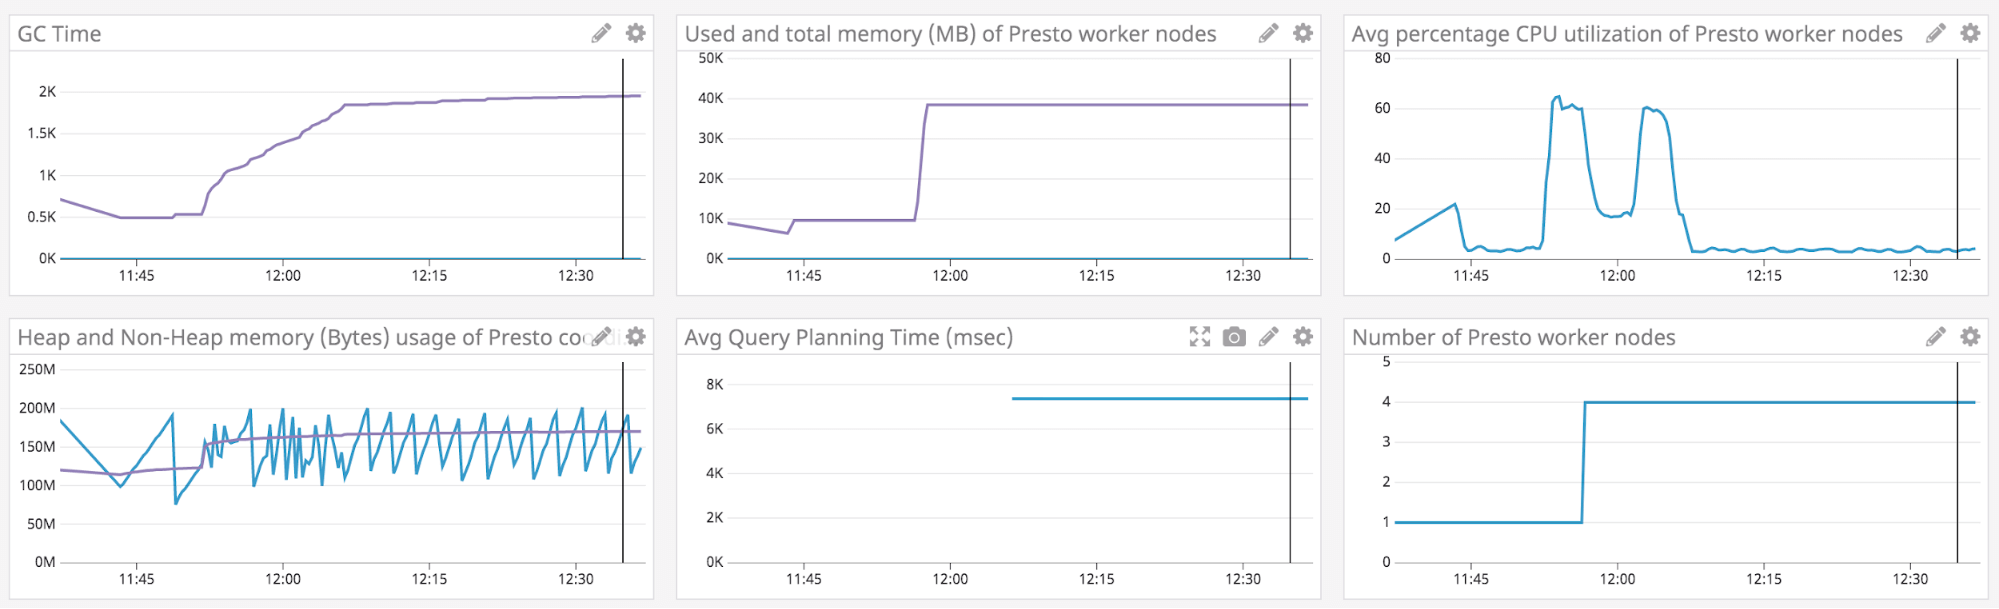
It is possible to set up several alerts and dashboards for monitoring the load on a Presto cluster. Also exported are system utilization metrics like (total_memory(sum of avgTotalMemoryUsed)) of all the Presto nodes in the cluster), used_memory) from Presto worker nodes to Datadog to understand cluster utilization in more detail. For example Presto.jmx.qubole.avg_per_node_max_used_memory_mb and Presto.jmx.qubole.avg_per_node_min_used_memory_mb help detect consistent skew in memory usage of the cluster. The graph below depicts memory and CPU utilization in the default dashboard.
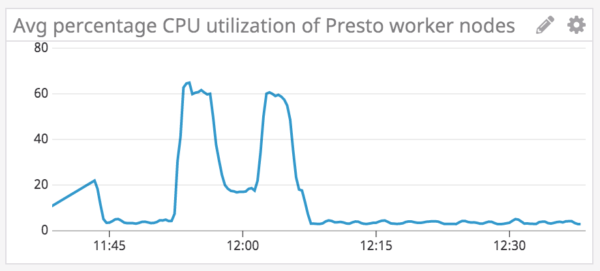
This graph indicates the average CPU utilization percentage, which is calculated as
Presto.jmx.qubole.avg_used_milli_vcores/Presto.jmx.qubole.avg_total_milli_vcores*100
For a complete list of metrics, dashboards, and alerts please refer to the Qubole online documentation.
Apart from these metrics, you can also monitor and send custom metrics. Additional metrics can be added in a different JMX instance; e.g.
/etc/dd-agent/conf.d/jmx_custom.yaml
in which Qubole places the default metrics, and restarts dogstatd(sudo monit restart dogstatd) to send custom metrics.
To persist the metrics upon cluster restart the custom config file can be uploaded to your object store, such as AWS S3, and can be copied to the correct location at the time of node bootstrap.
Sample bootstrap for sending the custom metrics:
s3cmd -c /usr/lib/hustler/s3cfg get --force

s3://dev.canopydata.com/bhargavis/scripts/hadoop/jmx_custom.yaml etc/dd-agent/conf.d/

sudo monit restart dogstatd
We have also upgraded the Datadog agent to the latest version 6. Agent v6 has significantly improved resource usage over Agent v5. Please refer to the respective Qubole online documentation section on this upgrade to learn about the advantages and improvements in v6.
To learn more about monitoring Presto on Qubole, sign up for a free trial on Qubole.