This final part of the three-part spark optimization series explains how a Spark application can be optimized for performance by using Qubole Sparklens. The blog will walk you through a real example of how we used Sparklens metrics and iteratively optimized the Spark ETL job for an enterprise customer.
The first blog explained how you can leverage heterogeneous configurations in Qubole clusters to maximize your chances of getting spot nodes.
The second blog explained how a Spark cluster on Qubole can be configured to achieve higher Spot utilization, which optimizes the job for lower costs while ensuring reliability.
Let’s start with a glossary of metrics that Qubole Sparklens offers. Qubole Sparklens, when enabled, provides these metrics out of the box.
Sparklens Metrics – Application Level:
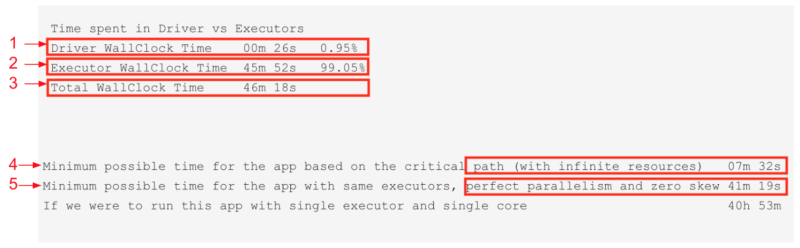
| Driver WallClock | Total time taken by driver to complete the execution. |
| Executors WallClock | Total time taken by all the executors to complete their execution. |
| Total WallClock | Driver WallClock + Executors WallClock |
| Critical Path | Minimum possible time for the app assuming unlimited resources. |
| Ideal Application | Minimum possible time for the app assuming perfect parallelism and no data skews. |
Sparklens Metrics – Stage Level:
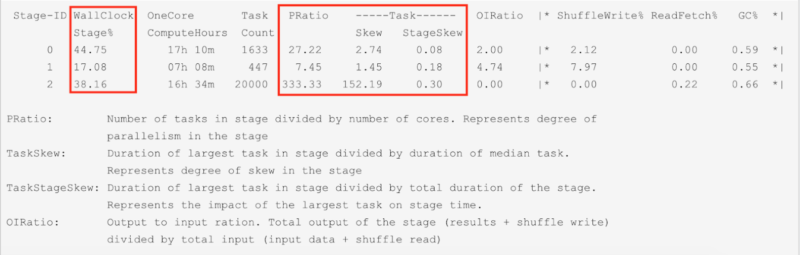
| WallClock Stage% | Time taken by current stage over Total time across all the stages |
| PRatio | Degree of parallelism = number of tasks in the stage / number of cores. PRatio > 1 => Too many tasks PRatio < 1 => Too many cores |
| TaskSkew | Degree of skew = largest task duration / median task duration. |
| TaskStageSkew | largest task duration / total stage duration |
| OIRatio | Total output of the stage (results + shuffle write) / total input (input data + shuffle read) |
As mentioned in part 1 of the series, the customer had a Spark ETL job that had reliability and performance issues. We resolved the reliability issue in part 2 of the series. The job still ran for over forty-six minutes. Now let’s look at how we optimized the job for performance.
Iteration #1:
To start with, I configured the customer’s spark ETL job to use Sparklens for generating the metrics by passing the following arguments to spark-submit.
–packages Qubole:sparklens:0.3.1-s_2.11</span
conf spark.extraListeners=com.qubole.sparklens.QuboleJobListener
Iteration #1 – Qubole Sparklens Output:
Application Metrics
Qubole Sparklens: Per Stage Metrics

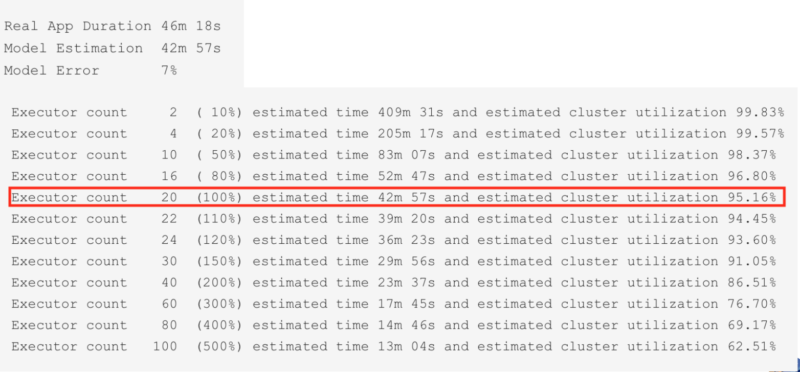
Qubole Sparklens: Simulation Model Metrics

Iteration #1: Consolidated view of Application Configuration and Sparklens Metrics
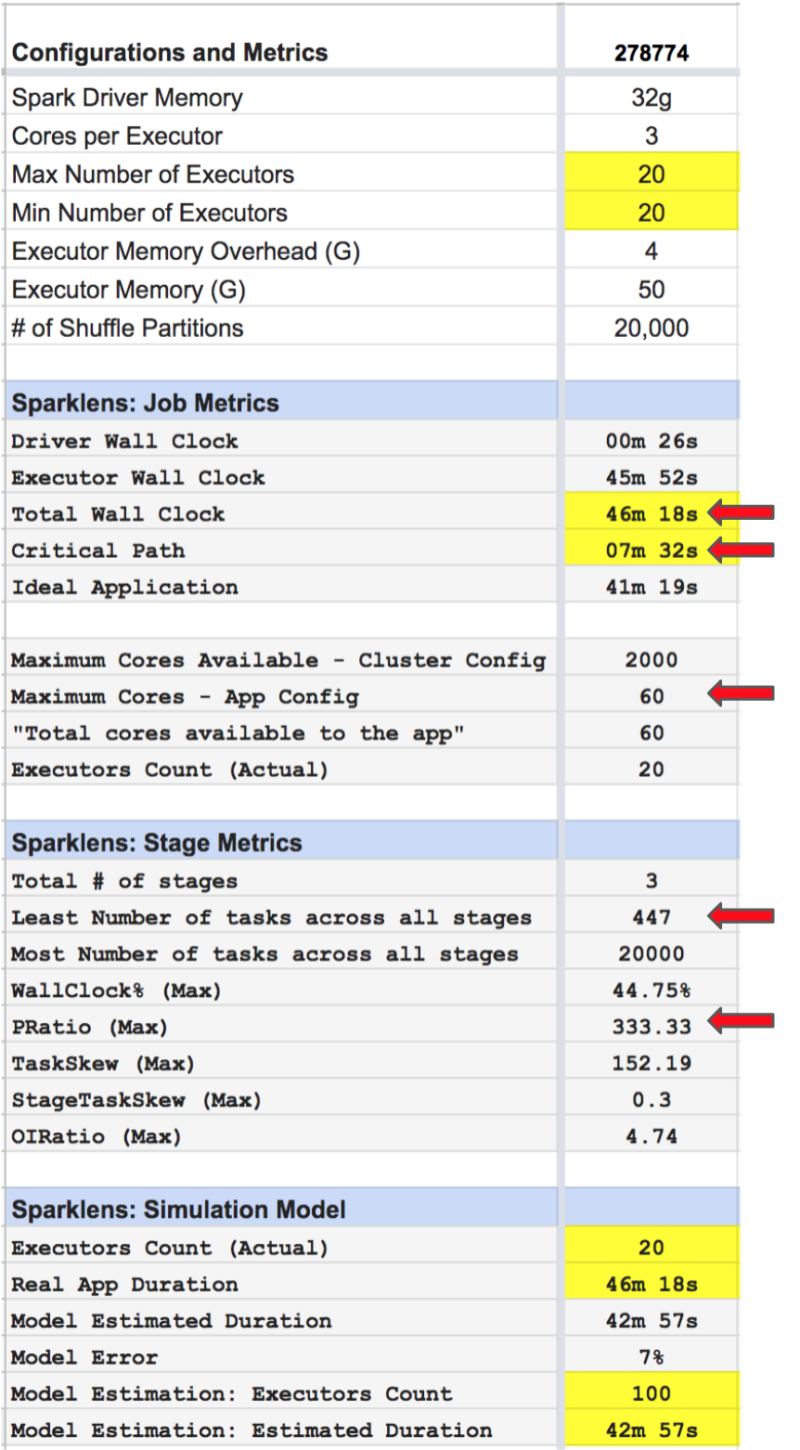
Iteration #1 Sparklens Metrics:
- Total Wall Clock = ~ 46m
- Critical Path = ~ 7m
- Maximum available cores as per App Config = 60
- Least number of tasks across all stages = 447
- PRatio = 333.33
Observations:
- There was a huge disparity between Critical Path and Total Wall Clock which confirmed that there was a lot of room to optimize resources.
- PRatio > 1 => Too many tasks, but not enough cores!
- Min Tasks across all stages = 447. => Adding more cores (one core per task) should increase parallelism and improve performance.
- 447 cores = 447/4 = ~ 112 Executors.
Next Step / Action:
- Increase Max Executors from 20 to 100.
For the next iteration, I decided to increase parallelism in the executor stage by adding more executors.
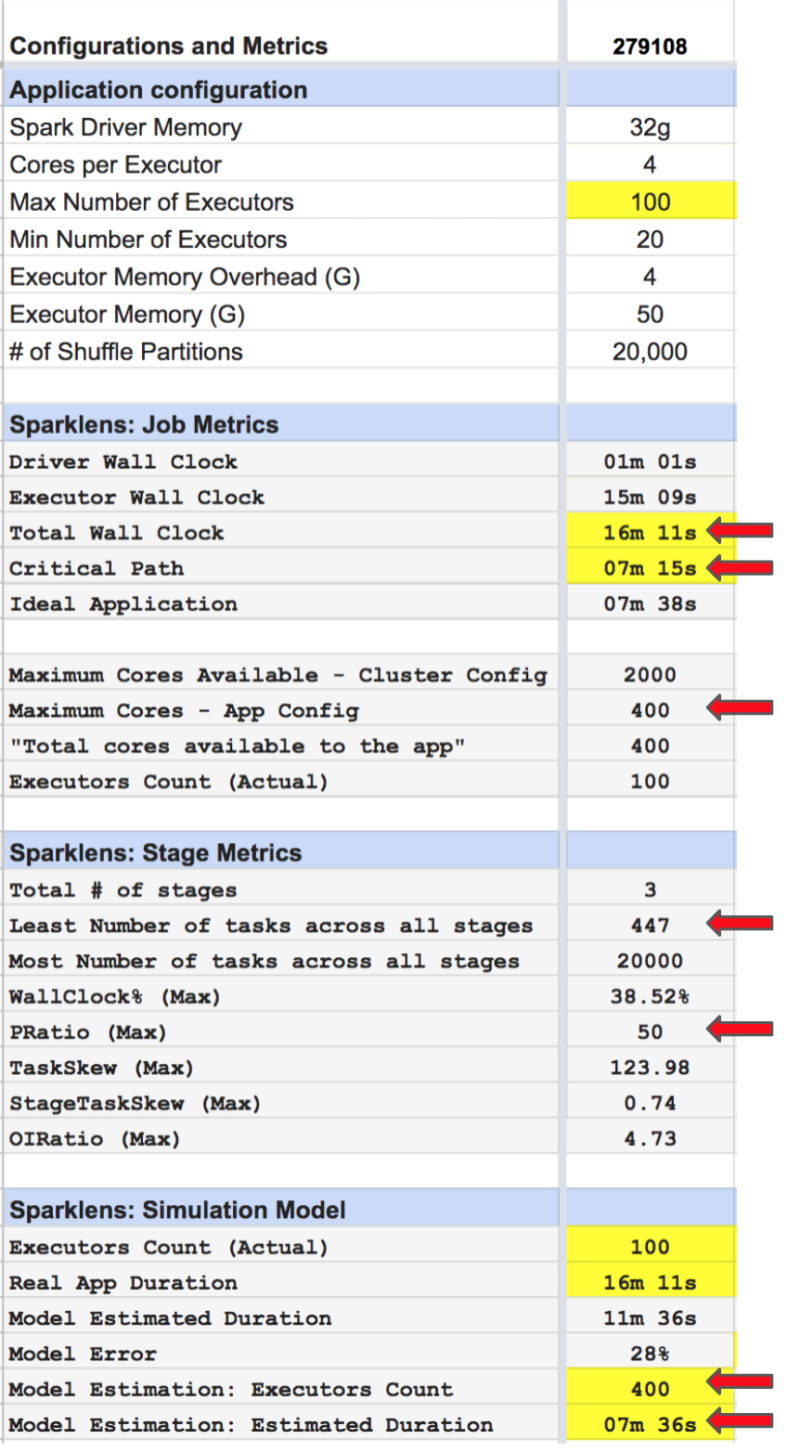
Iteration #2: Consolidated view of Application Configuration and Sparklens Metrics
Iteration #2 Sparklens Metrics:
- Total Wall Clock = ~ 16m
- Critical Path = ~ 7m
- Maximum available cores as per App Config = 400
- Least number of tasks across all stages = 447
- PRatio = 50
- The simulation model confirmed that adding more executors would help improve performance.
Observations:
- Total Wall Clock dropped drastically so increasing the max executors count from 20 to 100 helped. There is still a reasonable disparity between Total Wall Clock and Critical Path.
- PRatio dropped to 50 but it’s still high enough which indicates that there are more tasks than available cores.
Next Step / Action:
- Action: Increase Max Executors from 100 to 400.
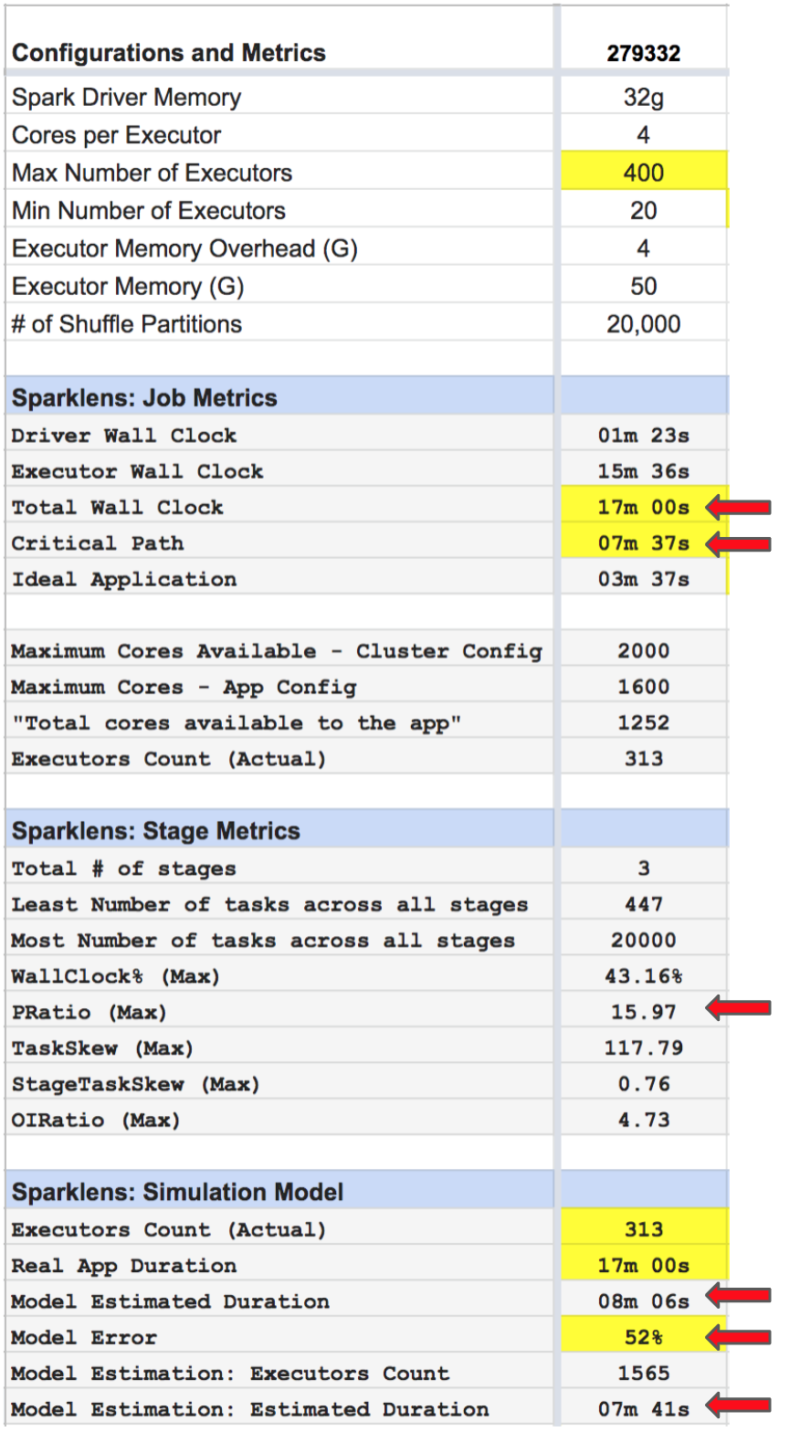
Iteration #3: Consolidated view of Application Configuration and Sparklens Metrics
Iteration #3 Sparklens Metrics:
- Total Wall Clock = ~ 17m
- Critical Path = ~ 7m
- PRatio = 15.97
- Model Error = 52%
- Model Estimation: Executors Count = 1420
- Model Estimation: Estimated Duration = ~7m
Observations:
- Increasing max executors from 100 to 400 did NOT help this time!
- Reason: Upscaling from 20 Min Executors to 400 Max Executors required the cluster to be upscaled which added some delays.
- The Disparity in Critical Path and Total Wall clocks confirms that there is still room to optimize resources.
- PRatio has dropped significantly from 50 to 15.97.
- The simulation model confirms that adding more executors would NOT help improve performance.
Next Step / Action:
- Action: Keep Max Executors to 400 but Increase Min Executors from 20 to 100 so that the required nodes are acquired immediately after job submission instead of waiting for spark auto-scaling to kick in.
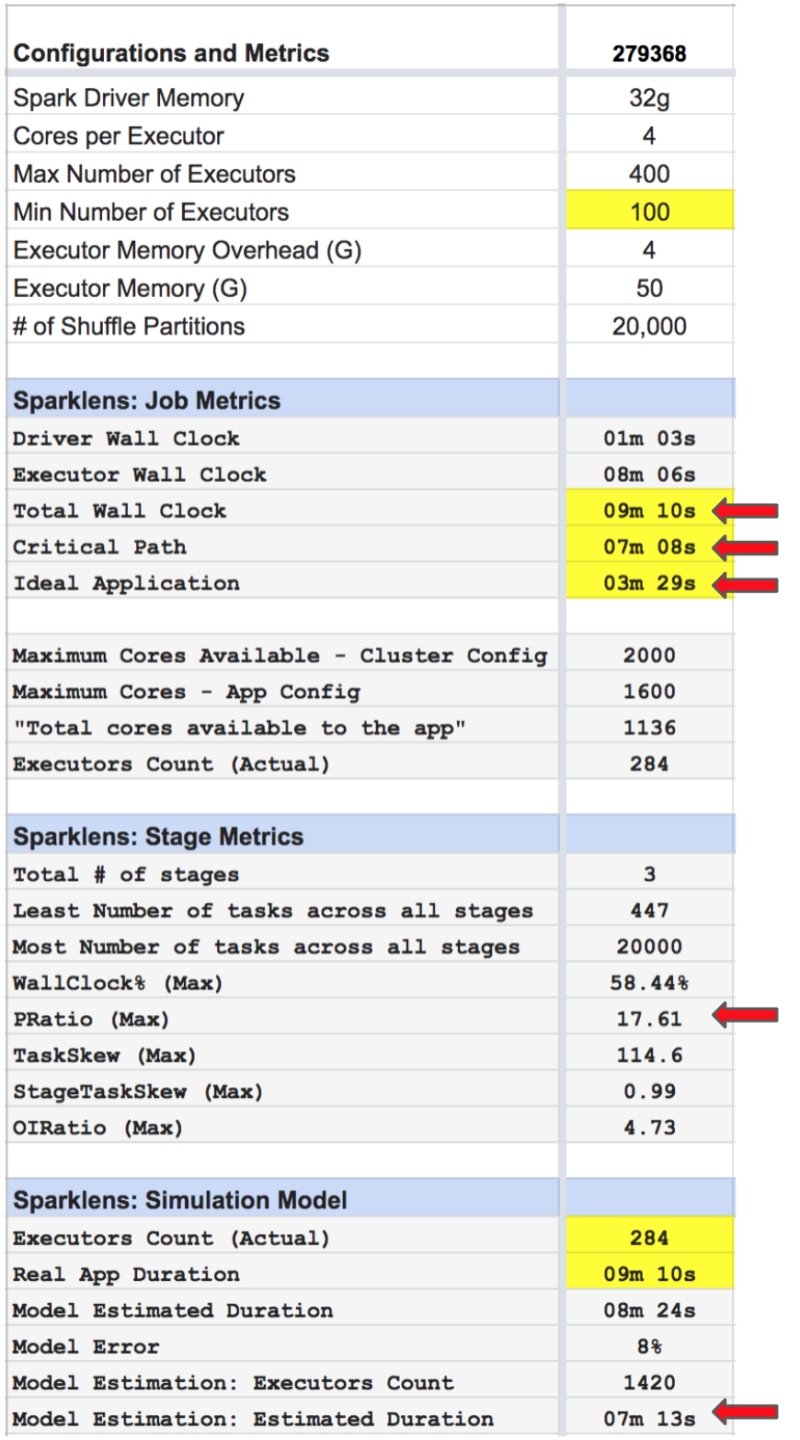
Iteration #4: Consolidated view of Application Configuration and Sparklens Metrics
Iteration #4 Sparklens Metrics:
- Total Wall Clock = ~ 9m
- Critical Path = ~ 7m
- Ideal Application = ~ 3m
- PRatio = 17.61
- Model Estimation: Executors Count = 1420
- Model Estimation: Estimated Duration = ~7m
Observations:
- The disparity in Total Wall Clock and Critical Path has reduced significantly.
- The disparity in Critical Path and Ideal Application means that there is data skew.
- The simulation model confirms that adding more executors would NOT help improve performance.
Next Step / Action:
- Action: Keep Max Executors to 400 but Increase Min Executors from 20 to 100 so that nodes are acquired beforehand.
Summary: Consolidated view across iterations
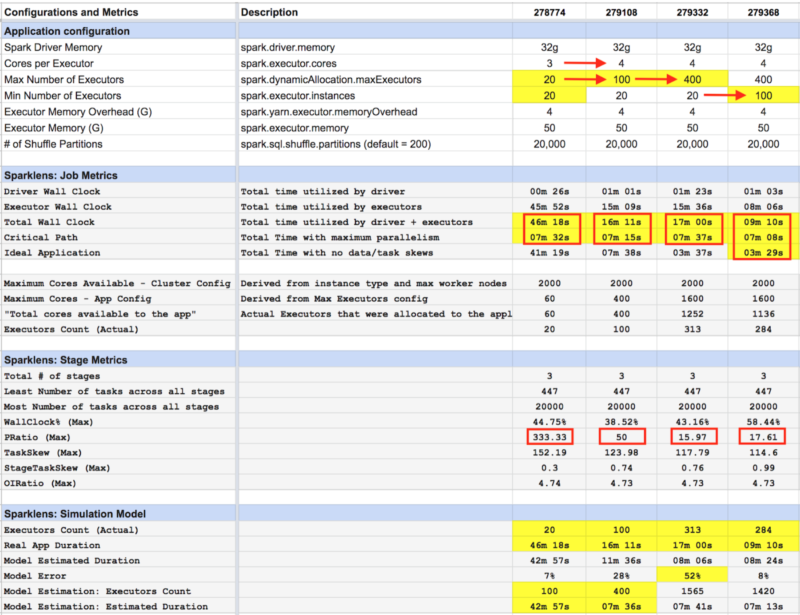
Impact Summary:
- Increasing max executors count from 20 to 100 increased parallelism significantly. The PRatio came down from ~333 to 50 and the Total Wall Clock reduced from ~46m to 16m.
- Increasing max executors count from 100 to 400 increased parallelism further up. PRatio came down from 50 to 15.97. Total Wall Clock remained flat.
- Increasing min executors from 20 to 100 brought down Total Wall Clock Time from ~17m to ~9m.
- 80% drop in latency: The job that originally ran for ~46 minutes was optimized to complete in ~9 minutes.
- The disparity between Total WallClock and Critical Path dropped significantly to a satisfactory level.
Thus, the spark application was optimized for performance by increasing the degree of parallelism using cues from sparklens metrics of the spark application.
Important considerations for sizing your spark applications:
- Concurrency and Cluster auto-scaling limits (min, max worker nodes):
The number of applications that may run concurrently and cluster autoscaling limits need to be considered while sizing the spark application. - Workload scaling limits (min, max executors):
The degree of parallelism of the spark application is limited to workload scaling limits configured for the application. - Beyond a certain threshold, adding more resources (executors and cores) will NOT help. Identifying that threshold for your spark application is extremely important to avoid unnecessary resource wastage and cloud costs.
- Performance vs cost trade-off:
Adding more resources will help complete the long-running stages faster. However, these additional resources, if acquired upfront for the entire duration of the job, can remain idle (unutilized) during the execution of smaller stages. This could drop cluster utilization and hence increase the overall cost.