Data scientists use Notebooks for data exploration, interactive data analytics, machine learning, and collaboration. Once set up, a Notebook provides a convenient way to save, share, and re-run a set of queries on a data source. JupyterLab is the next-generation enhanced User Interface (UI) for Jupyter Notebooks, the successor of the classic Jupyter Notebooks interface.
In this blog, we introduce Qubole’s latest Notebook service that combines the power of the JupyterLab interface with enhanced Apache Spark capabilities. Qubole Notebooks provide a consistent data analytics experience across multiple clouds. We will cover how Qubole Notebooks make it easy for data scientists, analysts, and business users to crunch big data and derive actionable insights.
JupyterLab – the UI for Jupyter Notebooks
JupyterLab allows you to work with your “.ipynb” Notebooks through a host of new features that allow you to view documents side by side in the work area by simply dragging the document to your desired position. You can also open multiple documents and other widgets as tabs in the work area.
To navigate the user interface, JupyterLab offers customizable keyboard shortcuts and the ability to use keymaps from vim, emacs, and Sublime Text in the text editor.
JupyterLab extensions can customize or enhance any part of JupyterLab, including new themes, file editors, and custom components.
Features of the JupyterLab interface
In the new Jupyter lab interface you will find yourself at home since it has various helpful features that are found in popular IDEs.
The Jupyterlab interface comprises the main work area which is the heart of the interface, where you can open multiple tabs of documents and a host of other supported widgets like Spark application, environments, etc.

JupyterLab comes with some remarkably excellent first-hand features like split views, dark theme, vim and emac-inspired keymaps, among others.
Split View
JupyterLab allows you to split your work area into a mix of various types of views.
Dark Theme
For dark theme lovers out there, JupyterLab has a built-in dark theme.
Keymaps
Users who love to get their work down with their most trusted editor vim would feel at home. JupyterLab supports vim-style keymaps.
The left sidebar contains a file browser, the list of running kernels, the command palette, the Notebook cell tools inspector, and the list of the tabs which are open and Notebook Examples.
The menu bar at the top of JupyterLab has top-level menus that expose actions available in JupyterLab with their keyboard shortcuts.
The status bar is at the bottom of the interface, which shows the active sessions running, the type of kernel, and the status of the kernel of the Notebook which is currently focused on.
Qubole adds the following features to JupyterLab to make analytics and ML easy
- Spark Application Status
- Spark Job Progress
- Integrated Package Manager
- Shared and Isolated interpreter modes
- Visualization with QViz
Spark application status and Spark job progress details on Jupyter Notebooks
Spark application status on Qubole Jupyter Notebooks
It’s not intuitive for data scientists to view the status of a Spark application, since you need to go to a different interface.
With Qubole, you can get the status of the Spark application under a single interface by simply clicking on the dropdown at the top right corner of your Notebook.
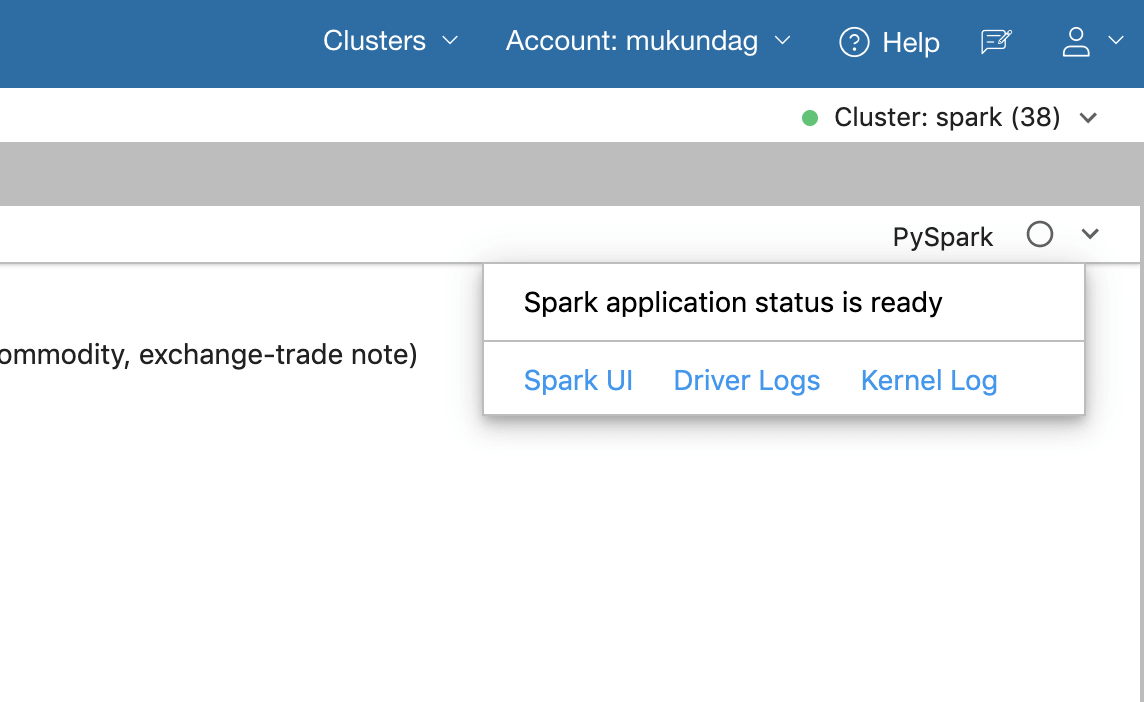
Along with the status of your Spark application, it also includes links to the Spark Application UI, driver logs, and kernel logs for power users.
Spark job progress on Qubole Jupyter Notebooks
A common challenge for data scientists is determining the status of their Spark jobs. This requires navigating through multiple screens and options.
With Qubole, data scientists can track Spark job progress and details at any point, within a single interface. Qubole provides a detailed view of running Spark jobs, including a progress bar of Spark applications, as well as links to the corresponding Spark application’s User Interface.

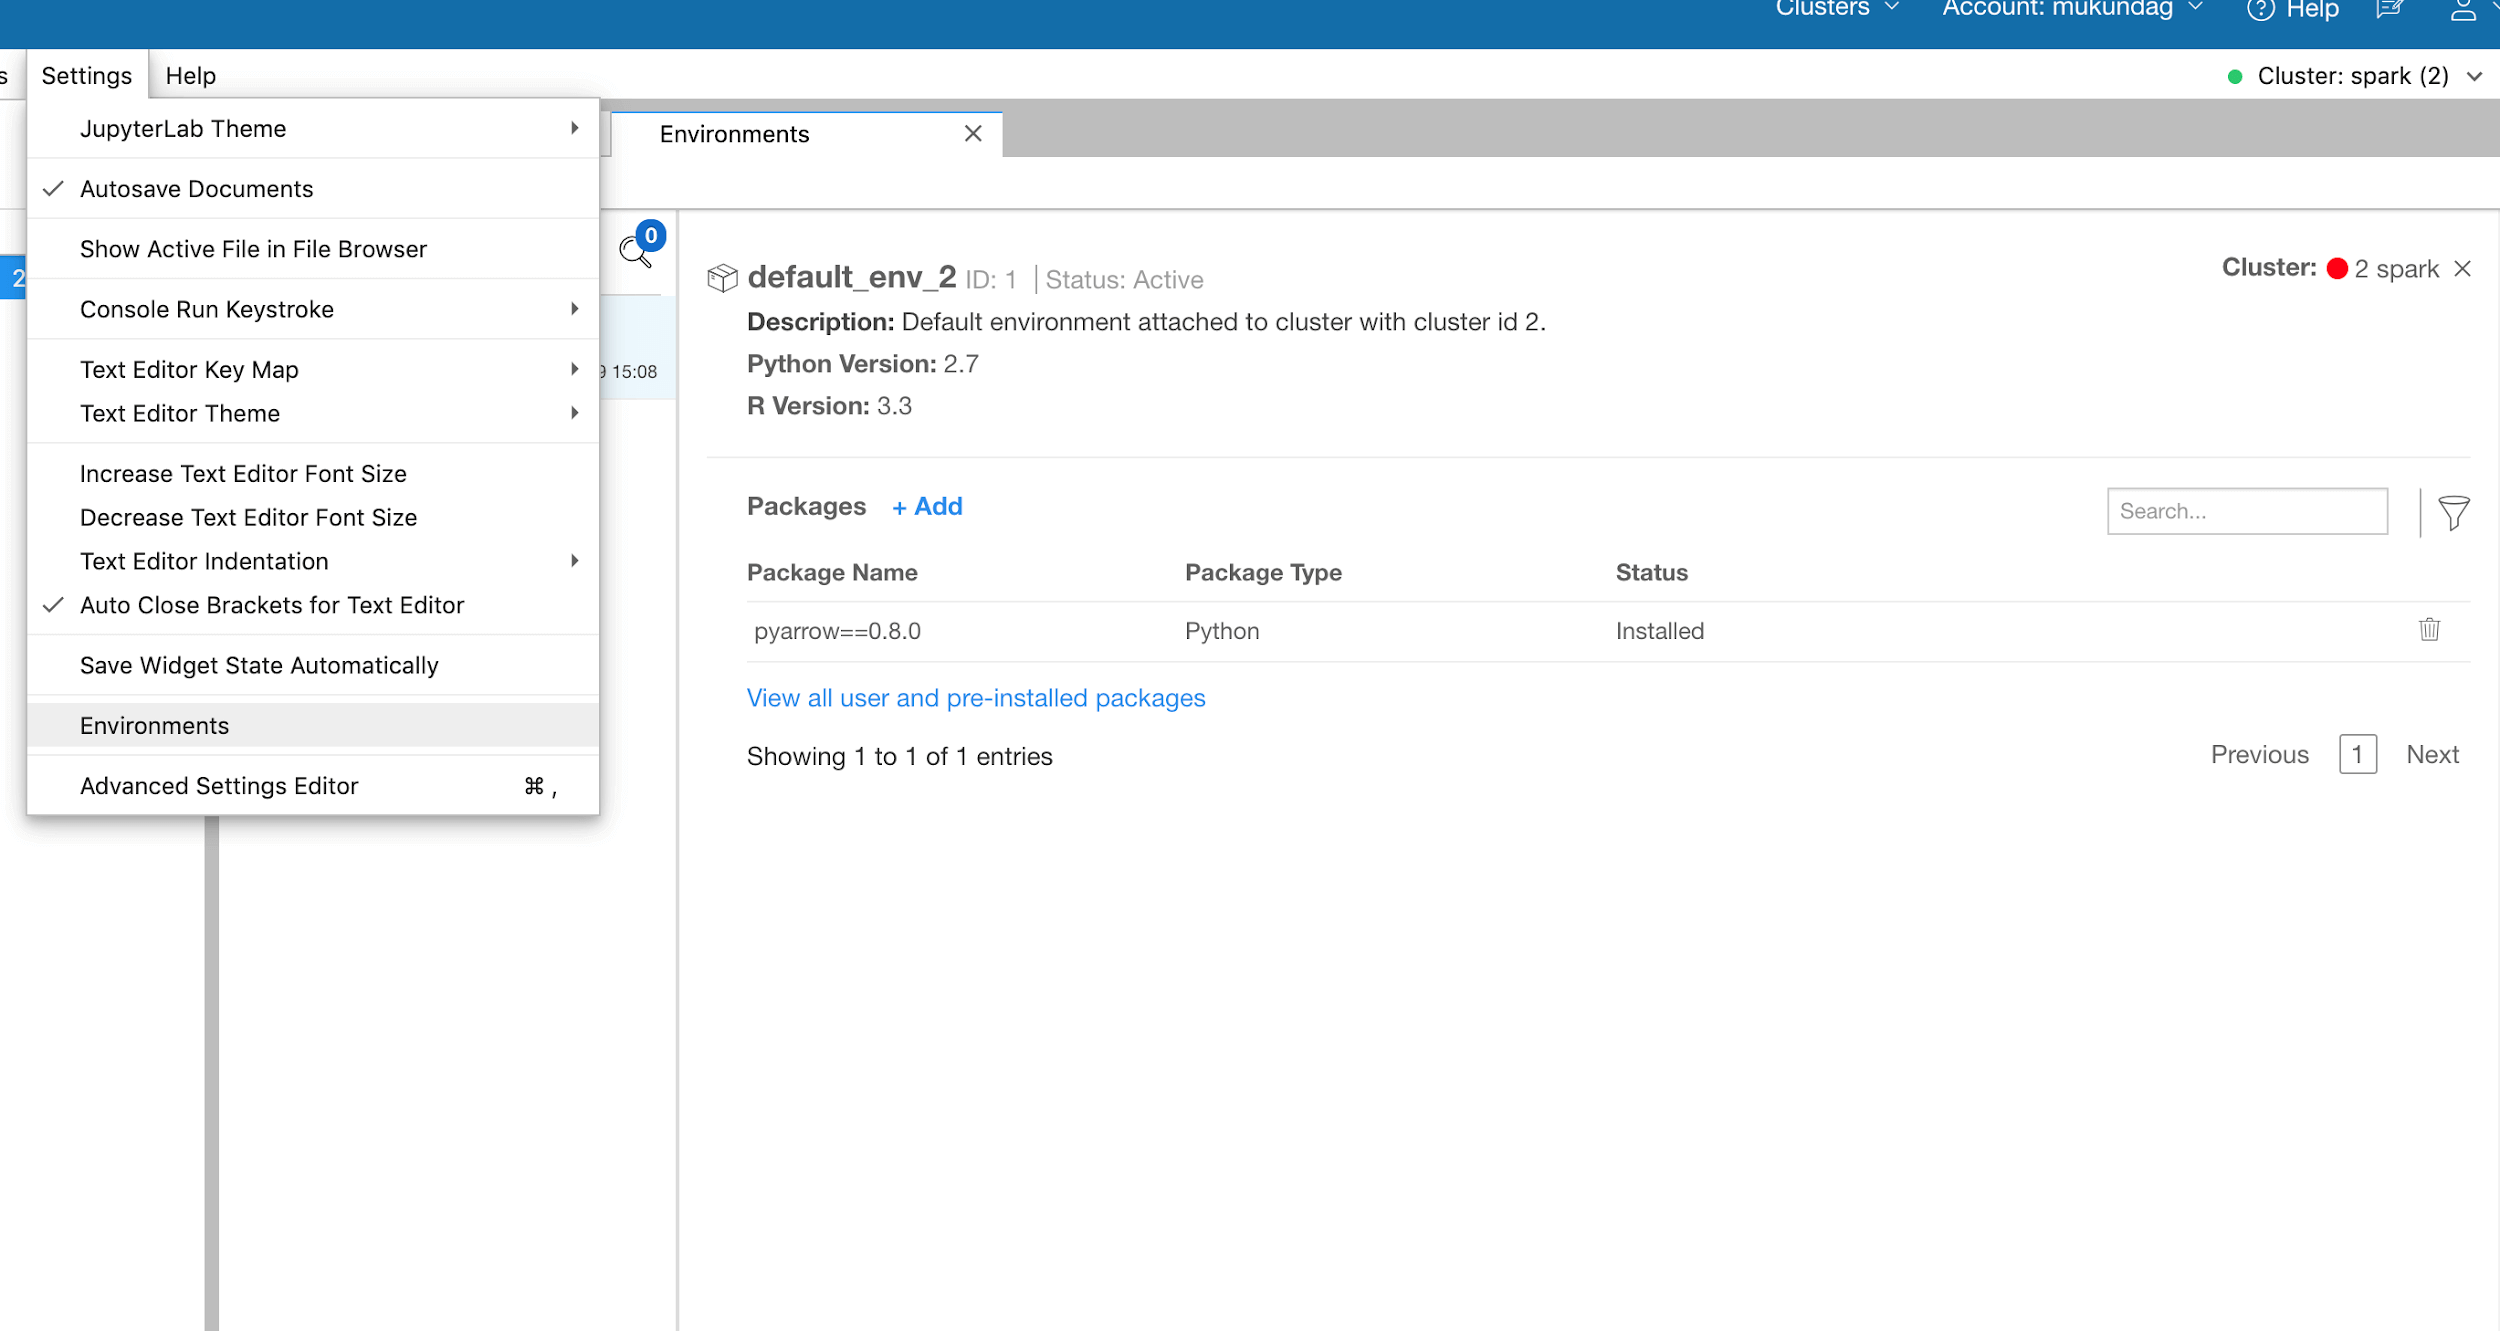
Integrated Package Manager on Qubole Jupyter Notebooks
The Qubole Package Manager comes integrated with Jupyterlab, so you can manage all your Python and R dependencies through a single interface.
Shared and Isolated Interpreter Modes on Qubole Jupyter Notebooks
You have the flexibility to choose between different interpreter modes. By default, all Notebooks of a user will be sharing the same Spark application. This mode provides the most optimal usage of resources available on your cluster.
In an Isolated interpreter mode, there is one Spark application per Notebook per user. All the resources and variables defined in this scope will be isolated from any other Spark applications present.
If you wish to switch to the Isolated interpreter mode you can do so with the help of configuring magic.
Visualizations with QViz on Qubole Jupyter Notebooks
The standard JupyterLab Notebook doesn’t include a prebuilt visualization library, unlike Zeppelin Notebooks. The options available in the market are limited, so users have to manually import third-party visualization libraries for displaying data frames.
Although SparkMagic comes prebuilt with the AutoViz widget—an ipywidgets-based implementation of visualizations that internally uses plotly to render a visualization,it has limitations that Qubole resolves with Qviz
Limitations with SparkMagic AutoViz
The main limitation is poor user experience, coupled with typical latency levels of 10 to 30 seconds (or more depending on output size). The reason for this is that the kernel can only process a single message at a time. So if it is busy and a user selects different chart types or new x and y axis, such requests will be queued until the kernel is available again.
Other limitations are:
- If the kernel is disconnected or terminated, chart controls stop working.
- If the Notebook is refreshed and the kernel is lost, then charts will not render.
- If a user switches to a different cluster and reopens the Notebook, charts are not rendered again.
Qviz to the rescue
Qviz is a Jupyter frontend extension that takes in a data frame serialized as JSON from SparkMagic and uses it to render different charts in the UI.
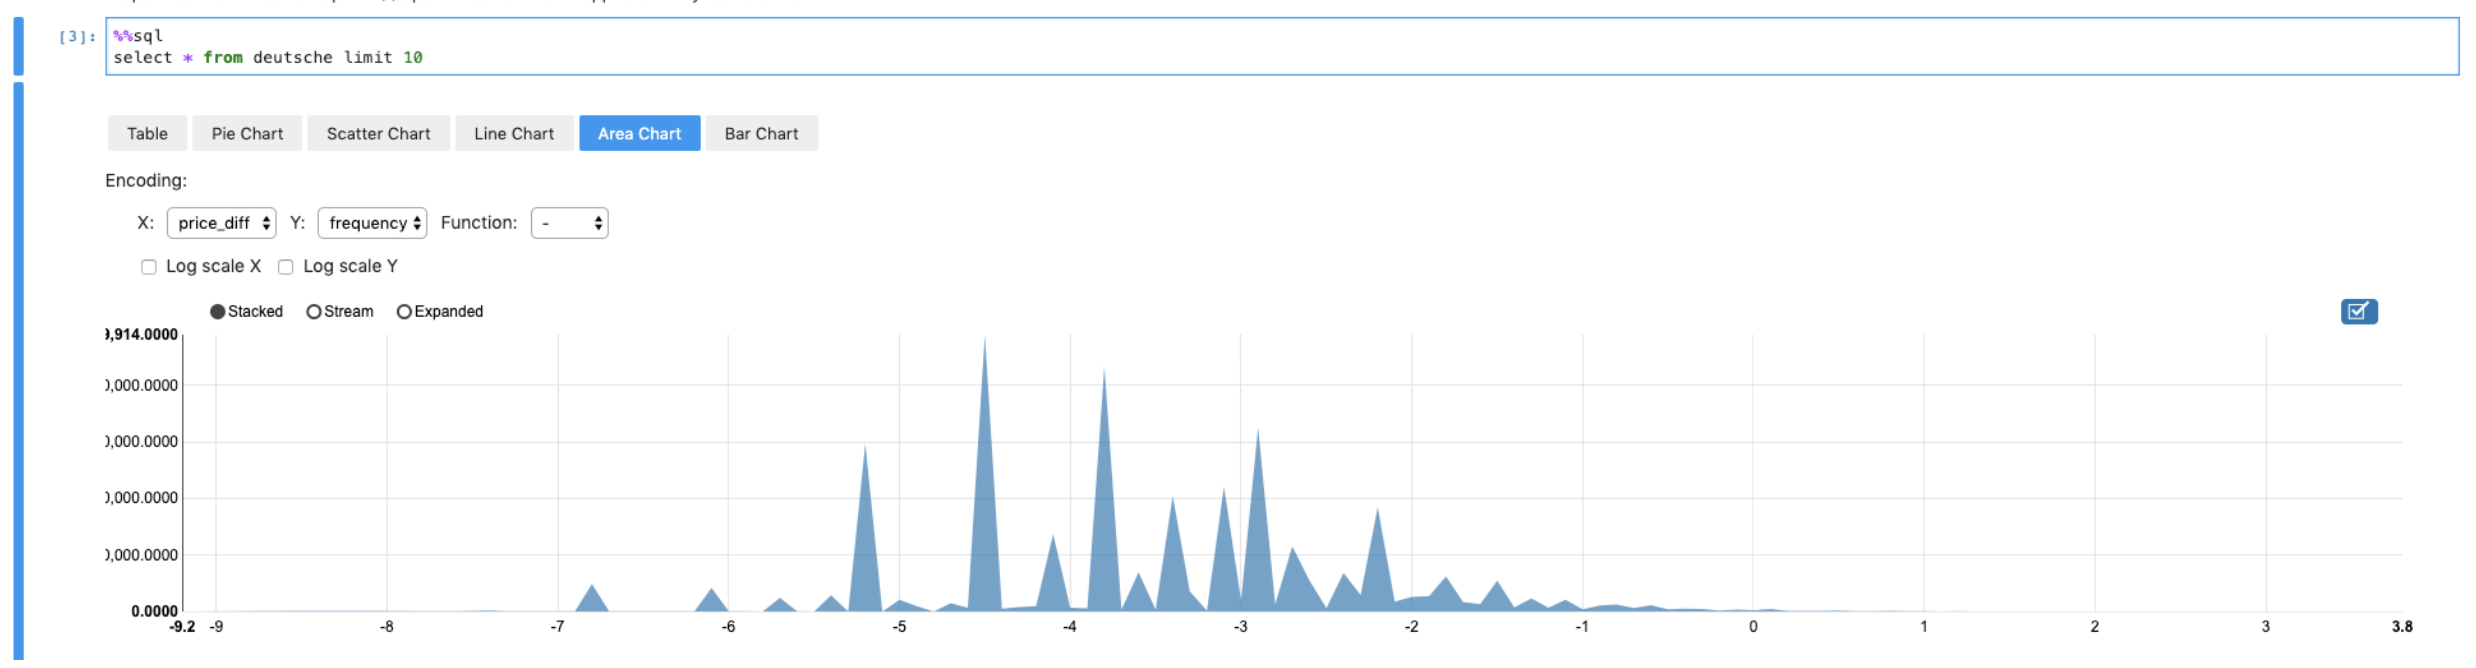
Advantages of using QViz, a UI-based widget for charting
- Since all the processing is done on the browser, the user doesn’t have to wait for the kernel to be free.
- Switching between charts is instantaneous.
- Selecting new x and y axis or selecting a new aggregate function will also be instantaneous.
- User chart settings are saved to Notebook metadata on a per cell basis, so when you reopen the same Notebook it will render the charts with the last-saved configuration.
How do I enable Jupyter Notebooks
As this is a closed beta. Please reach out to our support team if you wish to enable Jupyter Notebooks in your account.