Recently AWS announced support for AMD-powered instances. In this post, we compare the AMD and Intel instance types on cost and performance using common big data benchmarks. Our summary conclusion is that r5a (AMD) is better for I/O intensive workloads, while r5 (Intel) is better for CPU intensive ones. However, the performance and cost differences are small, and it may make sense to use both instance types in tandem in heterogeneous clusters.
Introduction
Recently AWS announced support for instances running AMD Epyc processors. While the new instances are 10 percent cheaper, cost and performance are workload-dependent. As the AWS announcement notes:
We recommend that you measure performance and cost on your own workloads when choosing your instance types.
This raises an obvious question: how do these instance types fare for the big data workloads that our customers run? To answer this question, we compared the performance of AMD and Intel instances using two sets of benchmarks common in the big data space:
- TeraGen and TeraSort for ETL workloads
- TPCDS for Data-Warehousing workloads
The rest of the post goes into the details of the benchmark setup, results therefrom, and conclusions.
Benchmark Setup
All benchmarks were conducted using Apache Hadoop, Hive, and Spark clusters available on Qubole in AWS.
Hardware Configuration
For our comparisons, we selected r5 series and 4xlarge instance types, given these are very popular across our user base. Below, we review some pertinent resource configurations for r5a.4xlarge and the comparable r5.4xlarge instance types.
| Instance | vCPUs | RAM | EBS Bandwidth | Network Bandwidth | Cost (per hour) |
| R5.4xlarge (Intel) | 16 | 128 GiB | 3.5 Gbps | Up to 10 Gbps | $1.008 |
| R5a.4xlarge (AMD) | 16 | 128 GiB | 2.120 Gbps | Up to 10 Gbps | $0.904 |
To minimize variables, we arranged each of the clusters with the following hardware configuration for our analysis:
- 1x Master Nodes: r5.4xlarge/r5a.4xlarge
- 4x Worker Nodes: r5.4xlarge/r5a.4xlarge (static hardware, no autoscaling)
- 1x SSD(gp2) EBS volume attached to each node (these instance types are EBS-only)
Software Configuration
All benchmarks have been run on clusters running Apache Hadoop 2.6, as available in the Qubole platform, which uses Apache Hadoop YARN as the underlying container scheduler.
- No proprietary Qubole features (such as Workload-Aware Autoscaling or Spot Instance node support) were used.
- No changes to default software configurations were applied
In terms of benchmarking methodology, we ran each benchmark thrice and took the best of the three runtimes. The Cost Calculation formula is listed here: Cost Calculations (Appendix).
Teragen/TeraSort Benchmarks
For this section, the following benchmarks were run:
- TeraGen: Generate 200GB data on S3.
- TeraSort: Sort 200GB of data generated above in S3 using MapReduce and write results back to S3.
These benchmarks are I/O intensive and involve reading/writing large amounts of data, which serves as a great example of a typical big data ETL pipeline. TeraSort is also quite CPU intensive.
Effect of EBS Volume Size
First, we ran these with an EBS volume size of 100GB attached to each worker node (for both r5 and r5a instances). The resulting runtimes are noted below:
| Workload | r5 (runtime in seconds) | r5a | Analysis |
| TeraGen | 315 | 423 | r5 faster by 25% |
| TeraSort | 1065 | 1474 | r5 faster by 27% |
Clearly, something was off with the r5a (AMD) cluster. Since TeraGen is not a CPU-intensive benchmark, the 25 percent performance differential on TeraGen is hard to explain. At this point, we noted that r5a instance types have slower EBS throughput than the r5 instance types. To give the instances a fair comparison, we increase the EBS volume size for r5a instances (relative to r5) and use this configuration for our subsequent benchmark runs.
Results
For the final results, we ran the benchmarks with 200GB EBS volumes for r5 instances and 330 and 400GB EBS volumes for r5a instances. The 330GB size was based on scaling the EBS volume by a ratio similar to the EBS bandwidth differences between r5 and r5a instance types. o see at what point the r5a instances achieved performance parity, we further increased the EBS sizes to 400GB.
| Workload | r5 200GB EBS | r5a 330GB EBS | r5a 400GB EBS | |||
| Time (seconds) | Cost ($) | Time | Cost | Time | Cost | |
| TeraGen | 287 | 0.41 | 309 | 0.40 | 280 | 0.37 |
| TeraSort | 980 | 1.41 | 1040 | 1.37 | 981 | 1.30 |
Conclusion
Our summary findings for TeraGen/Sort are as follows:
- TeraGen/Sort benchmarks are sensitive to local disk performance
- r5a instances need to be configured with higher EBS volume sizes (as compared with r5 instances) to achieve performance parity
- When correctly configured, r5a instances can offer equivalent performance at a slightly lower cost (seven to ten percent lower)
We do not entirely understand how increasing EBS volume sizes helps here – except that IOPS/throughput scales linearly in response to EBS volume size. Given that EBS bandwidth is not saturated at these volume sizes – it suggests that IOPS/GB for EBS volumes is lower for r5a instances as compared to r5 instances.
TPCDS Benchmarks
The TPCDS benchmark setup is as follows:
- The scale of Data: 1000GB
- Data format:
- ORC Files stored in S3 for Hive
- PARQUET Files stored in S3 for Spark
- 16 TPCDS queries from different categories.
We used a subset of the queries to speed up the benchmark runs. The selection methodology is listed under TPCDS Query Selection (Appendix). TPC-DS benchmark reports are divided into two parts. In Part 1 we benchmark Apache Hive, and in Part 2 we benchmark Apache Spark. Please refer to the Appendix below for the queries we used for this experiment.
Part-1: Apache Hive
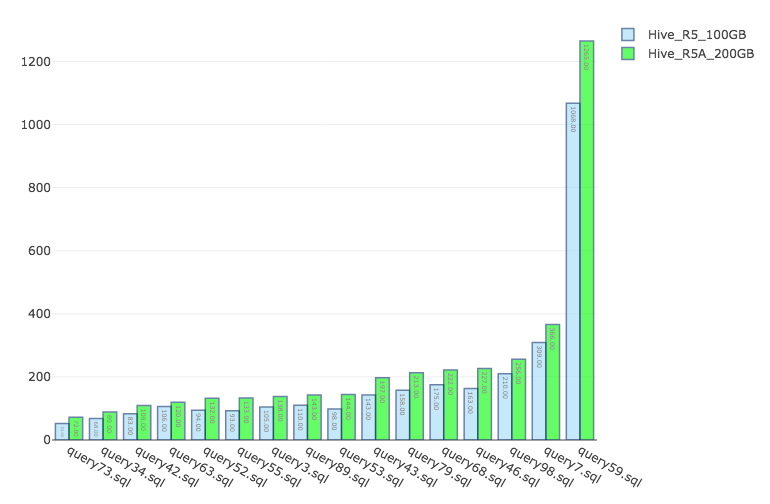
In this benchmark, we ran Apache Hive version 2.1 running with Apache Tez — as available on the Qubole platform. All queries are submitted via an HS2 server. We first ran the benchmark with 100GB EBS for both AMD and Intel-based instances — and then with higher EBS volume sizes for AMD instances. The results of our experiments are tabulated below:
| r5 (Intel) EBS = 100GB | r5a (AMD) EBS = 100GB | r5a (AMD) EBS = 200GB< | Analysis | |||
Time average query runtime in seconds | Cost ($) | Time | Cost | Time | Cost | |
| 189.69 | 0.26 | 244.88 | 0.31 | 239.12 | 0.30 | R5 faster by 25 % |
Part-2: Apache Spark
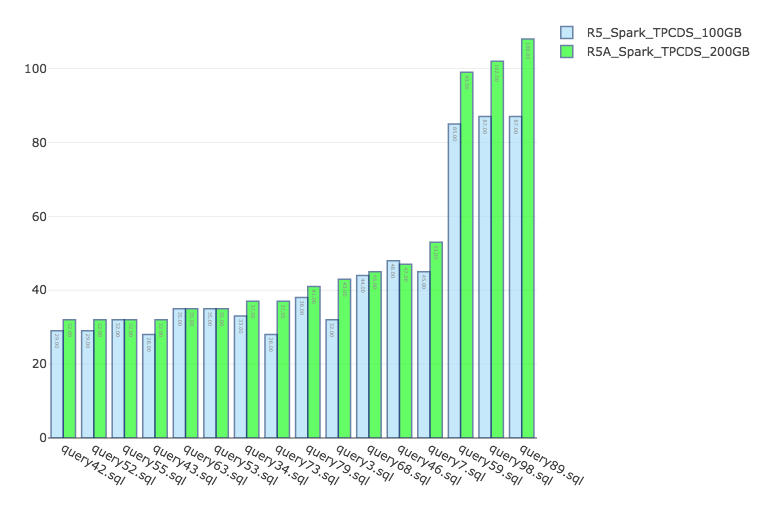
In this benchmark, we ran Apache Spark 2.3 as available on the Qubole platform. All queries are submitted serially to a single Spark application (provisioned via YARN). The approach here is the same as in the first part. The results of our experiments are tabulated below:
r5 (Intel) EBS = 100GB | r5a (AMD) EBS = 100GB | r5a (AMD) EBS = 200GB< | Analysis | |||
| Time average query runtime in seconds | Cost ($) | Time | Cost | Time | Cost | |
| 44.69 | 0.063 | 49.88 | 0.063 | 50.62 | 0.065 | R5 faster by 10.5 % |
Conclusion
Our summary findings from TPCDS benchmarks are as follows:
- TPCDS queries are not as sensitive to local disk performance (and hence to EBS volume sizes)
- r5 (Intel) instances are consistently faster than r5a (AMD) instances. However, the speedup depends on the engine and the speedup for r5 (Intel) is lower for Spark (10%) than for Hive (25%).
- r5 instances are also either cheaper (by about 10% for Hive) or the same cost (for Spark)
So the net conclusion for Hive and Spark, in the context of TPCDS benchmarks, seems to be that r5 (Intel) instances are superior. They are generally always faster than the r5a (AMD) — and sometimes even cheaper (for a given performance level) at the list price. However, there are some important additional points worth outlining that could affect the results:
- Results may vary, as the speedups/cost are workloads sensitive
- Spot market prices are variable and any cost numbers here are not valid for Spot instances
- Given how close the performance and cost numbers are — and the fact that r5a and r5 instances are otherwise identical in memory/vcpu, etc configurations — r5a may be a good choice for pairing with r5 instances for heterogeneous cluster configurations. This can potentially help in increasing the odds of getting Spot instances.
Appendix
Cost Calculations
For calculating cost of any benchmark run, we used the following formulae:
- Total Cost = Instance Cost + EBS Cost
- Instance Cost = num_instances * instance_cost_per_hour * runtime_seconds) / 3600
- EBS Cost = (num_instances * ebs_size_in_GB * runtime_seconds * ebs_cost_per_month) / (86400 * 30)
Please refer to AWS EC2 Pricing and AWS EBS Cost for details on AWS pricing.
TPCDS Query Selection
Below are the query categories and set of queries from each category that we picked for our analysis (with a total of 16 queries being chosen across all categories):
| Interactive (7) | query42.sql, query52.sql, query55.sql, query63.sql, query68.sql, query73.sql, query98.sql |
| Reporting (5) | query3.sql, query43.sql, query53.sql, query7.sql, query89.sql |
| Analytical (4) | query34.sql, query46.sql, query79.sql, query59.sql |
For more details on query categorization, please refer to this blog. For full TPCDS setup and queries, please refer to this notebook example.