The big data ecosystem is insanely complex — just making sense of the right tools and technologies can be more difficult than data mining itself. Only recently with the adoption of cloud can any company’s data teams have access to first-class big data technologies with automation that helps you save on cost and enables self-service access to greater varieties of data.
In this blog, I will suggest a comfortable starting point for some of the most popular big data engines through each step of an analytics lifecycle, from data preparation to visualization. Through this journey, we will explore why embracing choice and picking the right engine at each step of the analytics pipeline is critical to ensure success. Using a sample dataset as a reference, we will explore Qubole Hive, Spark, and Presto — all running with managed autoscaling.
Getting to Know the Big Data Engines
- Apache Hive is a ‘big’ data warehouse framework that supports analysis of large datasets stored in Hadoop’s HDFS and compatible file systems such as Amazon S3, Azure Blob, and Azure Data Lake Store File systems. Over the years, Hive has proven to be great for batch ETL and is very robust at scale.
- Apache Spark is an in-memory cluster computing framework originally developed at the University of California, Berkeley’s AMPLab. Spark excels in use cases like continuous applications that require streaming data to be processed, analyzed, and stored. Spark is also used for batch/streaming ETL and is very robust at scale, but using and practicing Spark requires a completely different skill set that is above and beyond SQL.
- Presto is an in-memory distributed SQL query engine for running interactive analytic queries. Developed out of Facebook, Presto plays a vital role in providing accelerated access to any data store and helps avoid the need to move activated/refined datasets to an on-premises or cloud MPP data warehouse for analytics and reporting.
In this context, we will use the NOAA weather dataset as a reference to explore the importance of choice. It is important to note that the rationale for choice depends on time-to-market considerations in combination with technical debt accrued and available skill sets on the teams executing the project.
About the Reference Dataset
Though the publicly available NOAA daily Global Historical Climatology Network (GHCN-DAILY) dataset cannot be categorized as a big data class dataset, it is continuously refreshed with weather updates from the previous day and has the breadth and depth of weather data for every single day since the late 1800s across many US geographies, which makes it an important dataset in the context of big data. Oftentimes businesses may need to figure out how the weather has been impacting their business or understand how weather correlates to the maintenance cycles of equipment for industrial preventative maintenance use cases.
Using Hive ELT Pipeline to Curate the Dataset for BI/Reporting
To start refining the reference dataset, we will first explore Hive. For technical details of how to use the Hive ELT pipeline to curate the weather dataset for BI and reporting, please refer to this more detailed blog.
The end result of the Hive ELT (Extract Load Transform) pipeline is a refined table that will have all daily weather data from the late 1800s across most geographies and cities in the US. This process also creates another lookup/master table for storing information on weather stations, which can be joined or used to filter or trend weather for any particular geography for reporting/BI purposes.
Using Spark to Curate the Dataset for BI/Reporting
Using the above Hive ELT pipeline as a reference, we saw how productive Apache Hive can be for curating a dataset. This section will focus on Apache Spark to see how we can achieve the same results using the fast in-memory processing while also looking at the tradeoffs.
With reference to this more detailed blog on the Spark ELT pipeline, curating the same dataset to achieve similar results in Apache Spark is more complex when compared to the Apache Hive ELT pipeline. But one distinct advantage with Spark is that we can take the Spark ELT pipeline forward to build a predictive model using Spark ML models that does feature engineering from different historical weather elements and perhaps produces some weather predictions. The rational architect in me would also argue that it would be better to curate the dataset as Hive tables in Apache Hive and then load them in Apache Spark for predictive/advanced analytics use cases. This argument may also depend on the skill sets that are available on the teams executing the project.
Interactive Analytics with Presto
So far, we’ve looked at how we can curate a reference dataset using Hive or Spark to achieve more or less the same end result (i.e. a curated, refined table stored in an optimized ORC format). We are now ready for ad hoc interactive analytics using Presto and Tableau. But among Hive, Spark, and Presto, which one is the right engine for enabling this use case? The answer is Presto.
One of the unique capabilities of Presto is that it can use multiple threads per worker across multiple machines when executing a query, which is great if you have high concurrency or a variety of large compute-heavy jobs. For example, if you have a Presto cluster using 10 compute nodes, each with a 4-core processor, then you’d effectively have 40 cores to execute queries across the cluster.
In this context, we will now explore how we can enable accelerated access to the curated weather dataset using Presto and solve the final piece of the puzzle — a BI/reporting use case that leverages Tableau to explore and visualize historical data trends.
For this purpose, let’s zero down on New York Central Park weather station with ID: USW00094728. To bring the New York weather data into Tableau and serve other ad hoc queries, let’s create a view in Presto using the below SQL.
DROP VIEW IF EXISTS GHCN_WEATHER_NY_CNTRL_PK;

CREATE VIEW GHCN_WEATHER_NY_CNTRL_PK AS
select * from
(
 select station_id, latitude, longitude, elevation, name,
 state, year,  month, day,
 ROUND(1.8*(element_at(element_map,'TMAX')/10)+32,2) as tmax,
 ROUND(1.8*(element_at(element_map,'TMIN')/10)+32,2) as tmin,
 element_at(element_map,'PRCP') as PRCP,
 element_at(element_map,'SNOW') as SNOW,
 element_at(element_map,'SNWD') as SNWD,
 element_at(element_map,'AWND') as AWND  FROM
 (
  select station_id, latitude, longitude, elevation, name,
  state,year, month, day, MAP(element_list,value_list) as element_map FROM
  (
   select station_id, latitude, longitude, elevation, name,
    state,year, month, day,
    array_agg(element) element_list,
    array_agg(value) value_list
    from noaa_weather.GHCN_DAILY_WEATHER_REFINED where
    station_id='USW00094728' and element
    in ('PRCP','SNWD','SNOW','TMAX','TMIN','AWND')
    group by station_id, latitude, longitude,
        elevation, name, state,year, month, day
  )x)y)
where tmax>-1767 and tmin>-1767
--Filter out the rows/records where temperature observations were not recorded
;
Using the view, let’s answer a few questions about extreme weather in New York. We can validate the results from a NY Central Park Extreme weather report published by weather.gov at https://www.weather.gov/media/okx/Climate/CentralPark/extremes.pdf.
1. What was the maximum recorded temperature in New York and when was it recorded?
Answer: 105.98 Fahrenheit, recorded on 9th July 1936
select  tmax, month, year, day , rank() over (order by tmax desc) from GHCN_WEATHER_NY_CNTRL_PK limit 1

################Result####################
tmax     month   year   day   _col4
105.98    7          1936   9       1
2. What was the lowest recorded temperature in New York and when was it recorded?
Answer: -14.98 Fahrenheit, recorded on 9th February 1934
select  tmin, month, year, day , rank() over (order by tmin) from GHCN_WEATHER_NY_CNTRL_PK limit 1

################Result####################
tmin     month   year   day   _col4
-14.98   2           1934   9      1
3. What was the warmest month in New York and which month & year was it recorded in?
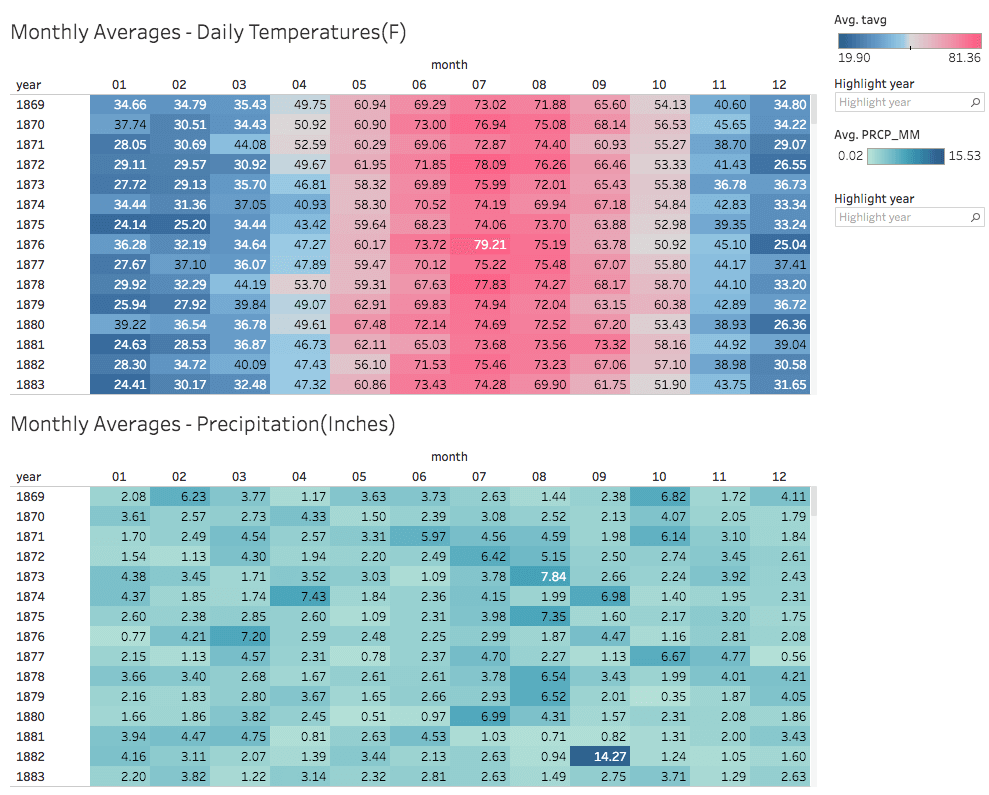
Answer: July 1999, recorded 81.36 Fahrenheit as average max daily temperature.
select  avg((tmax+tmin)/2) as avg_monthly_temp, month, year
from GHCN_WEATHER_NY_CNTRL_PK group by month, year
order by avg((tmax+tmin)/2) desc limit 1

################Result####################
avg_monthly_temp   month   year
81.36              7       1999
4. What was the coldest month in New York and which month & year was it recorded in?
Answer: February 1934, recorded 19.90 average daily temperature
select  avg((tmax+tmin)/2) as avg_monthly_temp, month, year
from GHCN_WEATHER_NY_CNTRL_PK group by month, year
order by avg((tmax+tmin)/2) asc limit 1

################Result###################
avg_monthly_temp     month   year
19.90                2       1934
5. What was the wettest month in New York on record and which year was it recorded in?
Answer: August 2011, recorded total precipitation of 18.95 inches.
select  SUM(PRCP * 0.003937) as prcp_inches, month, year
from GHCN_WEATHER_NY_CNTRL_PK group by month, year
order by SUM(PRCP) desc limit 1

################Result###################
prcp_inches     month   year
18.95           	8       2011
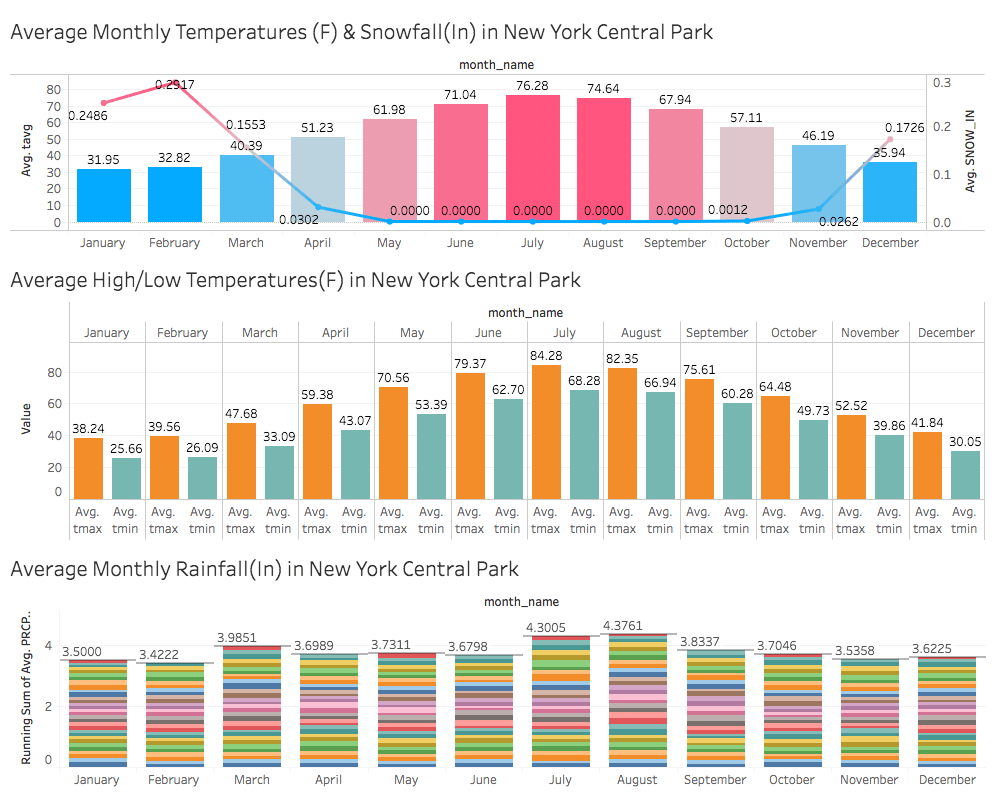
Using Qubole’s ODBC driver, Presto can be integrated with Tableau to facilitate visualizations of the curated weather dataset as seen below. Clicking on the dashboards will open an interactive version of the dashboards packaged as a Tableau Public workbook.
In Conclusion
Embracing choice in big data is vitally important. No one big data engine, tool, or technology is the be-all and end-all. The technical content for this blog was curated using Qubole’s cloud-native big data platform. Qubole offers a choice of cloud, big data engines, and tools and technologies to activate big data in the cloud. Sign up for a free Qubole account now to get started.