A Presto resource group is an admission control and workload management mechanism that manages resource allocation. The resource group mechanism ensures that groups using more than their allocated quota are penalized, preventing any group from exceeding its quota limit. It is a reactive gating mechanism that checks whether a resource group has exceeded its limit before letting it start a new query.
Many of our customers have tried to use resource groups for resource isolation, and this blog explains the not-so-obvious intricacies of resource groups in detail. For example, once a query starts execution, the resource group manager has no control over the query.
Resource groups in Presto can be configured like a tree, where non-leaf groups can be further subdivided into multiple resource groups.
Understanding Soft and Hard Limits for CPU and Memory
Resource groups in Presto define soft and hard limits for CPU usage and hard limits for memory usage (which is interestingly referred to as ‘softMemoryLimit’). Resource groups in Presto can control query scheduling based on a hard concurrency parameter, which can be configured either in isolation or in conjunction with soft limits on CPU utilization.
For memory, a soft limit expects the aggregated memory consumption of queries belonging to a group to keep within a certain limit. If the soft limit is breached, no new queries can be executed until the aggregated memory of the group queries falls below the soft limit.
For CPU, a Presto resource group manager tracks the total seconds during which a specific group executes queries. When this value crosses a threshold (referred to as ‘softCpuLimit’), the group’s maximum concurrency is reduced linearly so that it reaches zero when the group’s usage reaches another threshold (referred to as ‘hardCpuLimit’).
For CPU, resource groups also have a notion of cpuQuotaPeriod that defines the period in which CPU quotas are enforced. If a group has a hardCpuLimit of one minute of CPU time with the quota period being 10 minutes, if the group has used more than one minute in last 10 minutes, no queries can be run until the quota regenerates. CPU quota regeneration depends upon cpuHardLimit and cpuQuotaPeriod values for a group. For example, if the cpuQuotaPeriod is 100 seconds (equivalent to 1000 CPU seconds of execution time for 10 CPU cores) and the cpuHardLimit is 500 seconds, the group regenerates five CPU seconds of quota every second.
Presto internally tracks quotas using “usageMillis”. Every time a query completes, the system adds the cpuSeconds to this value, and every passing second regenerates this value by reducing it depending upon the quota of the group in question.
Key Configuration Parameters
To summarize, here are some key parameters that are used to configure resource limits and resource allocation via resource groups:
- cpuQuotaPeriod: The time period relative to which other CPU configurations are defined. This defines a period over which resource group limits are applied. The default value is one hour.
- hardConcurrencyLimit: The maximum number of queries in a “running” state for the group at any given point of time.
- softMemoryLimit: A memory limit that, if exceeded, prevents a group from scheduling new queries until the memory usage value falls below the softMemoryLimit. This can be either an absolute value or a percentage of total cluster memory.
- softCpuLimit, hardCpuLimit: The resource group has a “rate” of quota regeneration that a group can consume across the cluster without attracting penalty. The penalty scales linearly between a soft and hard limit.
- schedulingPolicy (optional): Specifies how queued queries are selected to run, and how sub-groups become eligible to start their queries. It can be one of the following three values:
- fair (default): Queued queries are processed first-in-first-out, and sub-groups must take turns starting new queries (if they have any queued).
- weighted_fair: Sub-groups are selected based on their schedulingWeight and the number of queries they are already running concurrently. The expected share of running queries for a sub-group is computed based on the weights for all currently eligible sub-groups. The sub-group with the least concurrency relative to its share is selected to start the next query.
- weighted: Queued queries are selected stochastically in proportion to their priority (specified via the query_priority session property). Sub-groups are selected to start new queries in proportion to their schedulingWeight.
- query_priority: All sub-groups must also be configured with query_priority. Queued queries will be selected strictly according to their priority.
Resource Group Configuration Example
Let’s start with an example in Presto documentation. The resource groups below have been modified to demonstrate the configuration of CPU limits for resource allocation. Since the CPU-related values depend on the number of cores in the system (aggregated number of cores across all worker nodes), let us assume that we have 10 cores available for execution across the worker nodes. Therefore, we have a total of 10 cpuSeconds worth of execution time for every real-time second.
In this example, we assume cpuQuotaPeriod is 1 hour (which should equate to 10 CPU hours worth of execution time). As shown in the diagram below, multiple resource groups have been configured. We highlight some of them below to demonstrate how they control resource allocation.
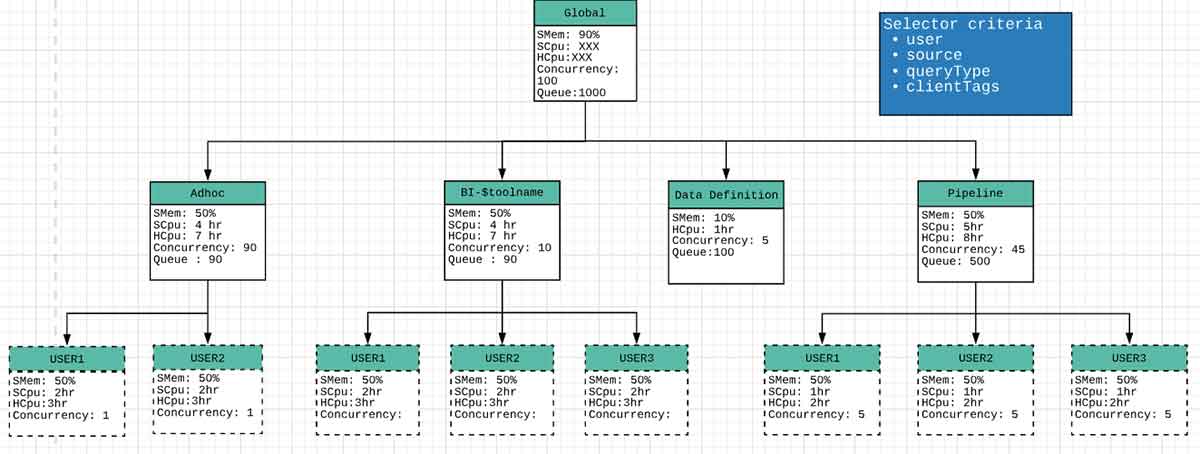
- Global Group: No more than 100 total queries may run concurrently in the cluster with a maximum of 1,000 queued at any time. Overall cluster memory utilization should not cross 90 percent.
{ "name":"global", "softMemoryLimit":"90%", "hardConcurrencyLimit":100, "maxQueued":1000, "schedulingPolicy":"weighted", "jmxExport":true, "subGroups":[..] } - Data Definition Group: Queries belonging to this group can have a maximum concurrency of five, and these queries are to be run in FIFO order. This group should not use more than 10 percent of CPU and memory resources.
{ "name":"data_definition", "softMemoryLimit":"10%", "hardConcurrencyLimit":5, "maxQueued":100, "schedulingWeight":1, "hardCpuLimit":"1hr" } - Pipeline Group: Non-DDL queries with the source as “pipeline” will run under the global.pipeline group, with a total concurrency of 45 and a per-user concurrency of five queries. Queries are run in FIFO order. These should use a maximum of 50 percent of total available CPU resources. This is because cpuQuotaPeriod is configured as one hour (which equates to 10 CPU hours worth of execution time, and a hardCpuLimit of five hours implies a maximum of 50 percent of total available CPU resources).
{ "name":"pipeline", "softMemoryLimit":"80%", "hardConcurrencyLimit":45, "maxQueued":100, "schedulingWeight":1, "jmxExport":true, "hardCpuLimit":"5hr", "subGroups":[ { "name":"pipeline_${USER}", "softMemoryLimit":"50%", "hardConcurrencyLimit":5, "maxQueued":100 } ] } - BI-$toolname Group: There is one resource group per BI tool. Each tool can run up to 10 concurrent queries, and each user can run up to three queries. If the total demand exceeds the limit of 10, the user with the fewest running queries will get the next concurrency slot. This policy results in fairness when the order is in contention. This group should use around 40 percent of available CPU (four hours out of 10 hours of CPU time) and a maximum of 50 percent of available memory.
- All remaining queries are placed into a per-user group under global.adhoc.other that behaves similarly.
To assign queries to resource groups, Presto has a concept of selectors. Each selector specifies a set of query properties such as user or source. Selectors are defined in an ordered manner, and the first selector whose criteria the query matches will be assigned that query. More details about selector rules can be found in the resource groups documentation.
Resource Group Functioning Example
Let’s see how resource groups restrict resource usage with the help of the diagram.
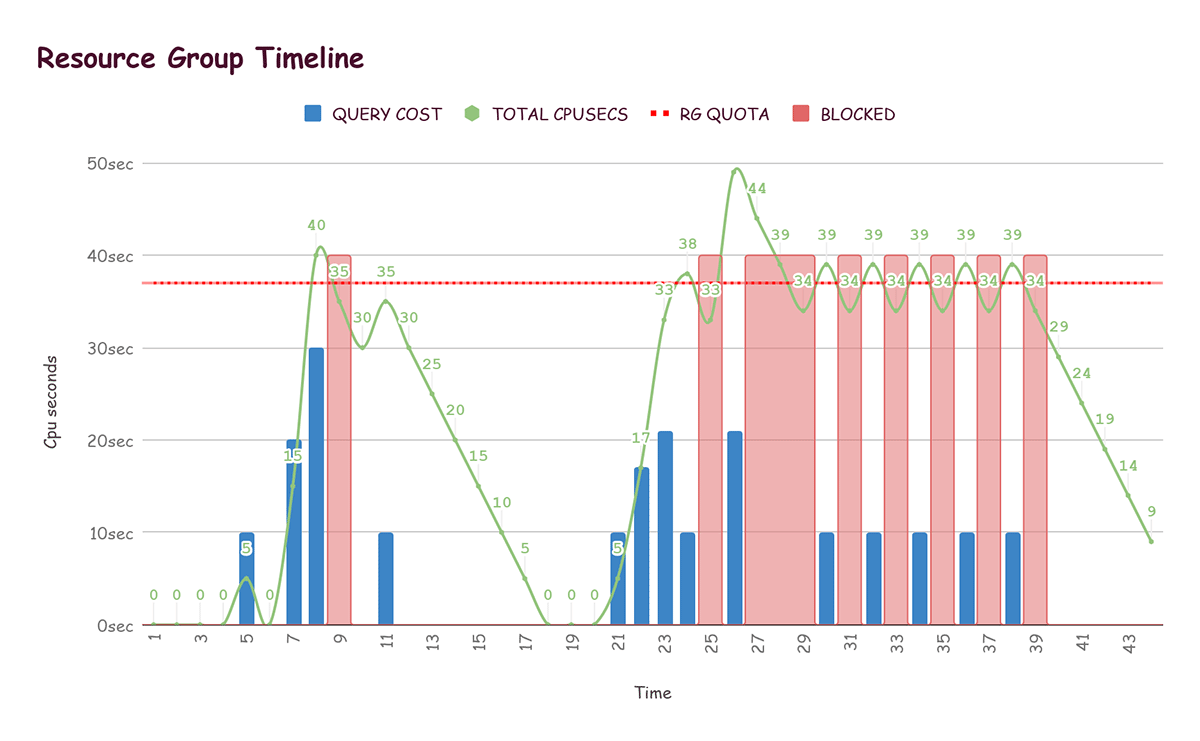
- Here we have assumed the quota regeneration rate to be five units per second. This means that with every passing second, five units are reduced from the currently consumed quota value (shown as Total CPUSecs – the green curve in the diagram below), which is equivalent to regenerating five units of quota.
- For the sake of simplicity, it is assumed that both the hard and soft limits totalAvailableQuota) are the same (37 units) in this example (shown as RG Quota – the red dotted line in the diagram below) for the query.
- Every second, an update method is called that recursively goes through the resource group structure and updates the eligibility of each group to start more queries.
- Once a query completes, the number of cpuSeconds taken by the query (shown as Query Cost in the diagram below) are deducted from the totalAvailableQuota for the query.
To summarize, here are the key terms that are used in the diagram above:
- Total CPUSECS: Running CPU utilisation for a resource group. Every time a query completes, we add total CPU seconds taken by the query (Query Cost) to it. Otherwise, it decreases by the regeneration rate (in this case, five units) each time cycle (each second).
- Query Cost: Total cpuSeconds taken by the query just completed.
- Quota: Horizontal dotted line shows the total quota allotted to the resource group. Once the CPU utilization of a group (total CPUSecs) exceeds the quota, the execution of any query from that group is blocked until total cpusecs come below the quota.
- BLOCKED: The resource group is blocked and cannot start executing new queries.
The red blocks in the graph represent times at which the the resource group was not allowed to run more queries because it had exceeded the quota (until total CPUSeconds falls below the quota).
Scenario 1: One query
At time t=5, the first query is completed for the resource group under consideration. Since a quota of five seconds is regenerated every second, we update the total CPUSeconds to (10 – 5 =) 5 seconds.
In the next cycle, we reduce five again from total CPUSeconds, which becomes and stays at zero until completion of the next query.
Scenario 2: Big query completion
At time t=26, total CPUSeconds reached 49 and the resource group is not allowed to start a query until total CPUSeconds value comes under the quota limit of 37. It takes a total of three cycles (15 units) to bring the total CPUSeconds under quotaLimit.
Scenario 3: Resource group limits are hit continuously
Let us assume that one query completes every second starting at time t=30, and there are five queries in the queue. The red bars represent time units when query submission is blocked due to exceeding total CPUSeconds. If we focus on the section between t=30 and t =38, we can see that there are alternate red blocks, since the resource group fluctuates between running and blocked states due to high load.
At t = 31, totalCPUSecs is 34 and a query completes with total execution time of 10 seconds.
At t = 32, totalCpuSecs becomes 39 as 10 seconds due are added to query completion, and five seconds are subtracted due to quota regeneration (34 + 10 – 5 ).
Conclusion
Resource groups are an important construct in Presto to control resource usage and query scheduling. Many Qubole customers have expressed interest in trying out resource groups for their production workloads, but were unable to do so because of the complex configuration involved. In this blog post, we discuss the details of resource group configuration and functioning to encourage their adoption and usage in production scenarios.