In this blog post, we’ll show you how we collect metrics and set up alerts to ensure the availability of Qubole Data Service (QDS).
QDS Architecture
Before getting into the details about monitoring, we’ll give a quick introduction to the QDS architecture.
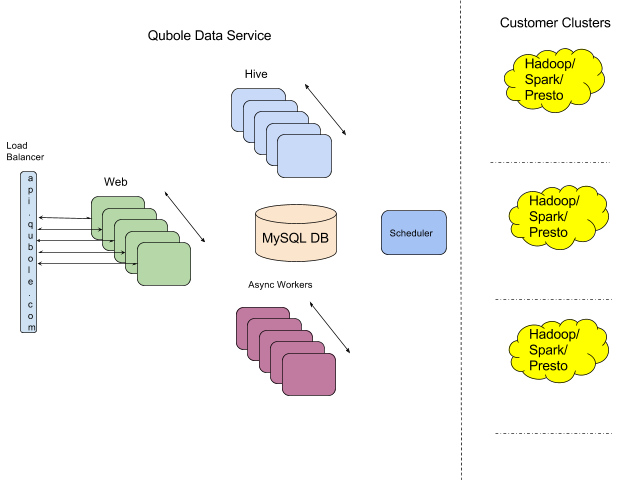
QDS runs and manages Hadoop/Spark/Presto clusters in our customers’ AWS, GCP, or Azure accounts. For this post, we are focusing on the monitoring of the core QDS web service, rather than the metrics and alerts on clusters running in customers’ accounts.
As shown in the diagram above, QDS follows a Service-Oriented Architecture (SOA) with Hive, Async workers, and a scheduler as the prominent services. We run multiple instances of QDS in each of the development, QA, and production modes. The tiers are implemented in a combination of Java, Python, and Ruby. We currently run QDS in AWS regardless of whether customer clusters are started in one of the other supported public clouds. However, we want the monitoring architecture to be cloud agnostic to be able to run QDS in other clouds.
Metrics Collection
Metrics can be categorized into system and application metrics.
System Metrics
System metrics are collected in one of the following methods:
- AWS CloudWatch – AWS CloudWatch provides a set of default metrics for each service. For e.g. CPUUtilization for EC2 machines or DatabaseConnections for AWS RDS.
- collectd – for system metrics missing in AWS CloudWatch. A couple of examples are DiskUsage for EC2 machines or QueriesRunning on AWS RDS.
- TCollector – for system metrics missing in AWS CloudWatch. I’ll explain why we use both TCollector and collectd later.
Application Metrics
QDS is implemented primarily in Java and Ruby. We are fans of Codahale Metrics architecture with MetricsRegistry and Reporters.
For Ruby, we found Metriks to be a very mature gem to collect Ruby application metrics. We did not find a good gem for reporters. We started a Github project Metriks-Addons to collect reporters as well collect common metrics useful in a Rail project a la Dropwizard.
For Java services, we use DropWizard for developing the REST API. Codahale Metrics and a rich ecosystem of reporters are readily available.
Time Series DB
AWS CloudWatch metrics are stored in its own DB. For production installations of QDS, we use SignalFX. For all other environments, we run OpenTSDB on a Qubole HBase cluster. Our choice of OpenTSDB on HBase is definitely biased. The main motivation was to dogfood our HBase product. We use the setup for experiments on both metrics as well as Qubole’s HBase.
Dashboards
We do not use AWS CloudWatch dashboards. We had invested efforts into other options before dashboards were announced. We use Grafana on top of the OpenTSDB cluster for dev and staging environments. SignalFX has charts, dashboards, and events with standard features important to us. One feature that is really useful is the ability to plot derived time series – for e.g. DBCPUUtilization/NoOfCommands.
Alerts
Historically we have set up simple threshold alerts on AWS CloudWatch. In cases where alerts are required on derived time series, we calculated the time series and uploaded it.
Over time, we are moving away from AWS CloudWatch metrics. The first reason is that we can outsource the computation of derived time series and alerts to a service like SignalFX. Secondly, AWS CloudWatch requires an alarm to be defined per instance of a metric. For example, if I want an alarm if DiskUsage > 80% on any instance with a tag, I have to create an alarm for each EC2 instance in my service. This is onerous in a highly dynamic environment like QDS where machines are spun up and down many times a day. Other services provide the ability to define alarms on a set of machines whose membership can change. Finally, some of the metrics are at the 3-minute or 5-minute granularity and we need 1-minute granularity.
A major gap in our setup is the lack of alerts on metrics in the OpenTSDB cluster. We are experimenting with Bosun for alerts on the OpenTSDB cluster.
Wrapping Up
Hopefully, you got an idea about our current infrastructure with respect to metrics and alerts. We are constantly evolving as we scale the infrastructure for larger and larger workloads. If you are interested in joining us on this exciting journey, please apply on the Qubole Careers Page.