With the increasing adoption of big data for various business processes, cloud expenditure is growing increasingly more important and, in some cases, becoming a limiting factor. As a Qubole Solutions Architect, I have been helping customers optimize various jobs with great success. In some instances, annual cloud cost savings resulting from optimizing a single periodic Spark Application can reach six figures.
Spark is a big data tool that has been utilized for machine learning, data transformation, and many other use cases. Spark supports multiple languages such as Scala, PySpark, R, and SQL. Spark provides many configuration parameters that allow you to optimize the Spark Application. However, it can also make optimization look intimidating. This article aims to demystify Spark optimization and walk you through some of the best practices for optimizing Spark in the Qubole environment.
Understanding the Spark Application
Spark consists of a single driver and multiple executors. Spark can be configured to have a single executor or as many as you need to process the application. Spark supports autoscaling, and you can configure a minimum and the maximum number of executors.
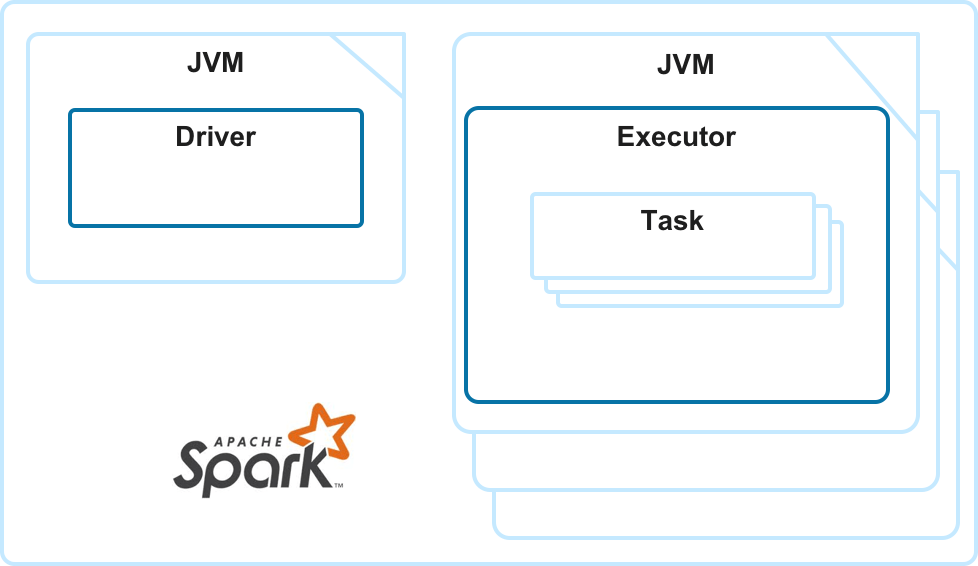
Each executor is a separate Java Virtual Machine (JVM) process, and you can configure how many CPUs and how much memory will be allocated to each executor. Executors run tasks and allow for distributed processing. A single task can process one data split at a time.
While running your application, Spark creates jobs, stages, and tasks. Without going too deep into the mechanics, jobs consist of stages, and stages consist of tasks. Stages are usually executed sequentially, while tasks can be executed in parallel in the scope of a single stage.
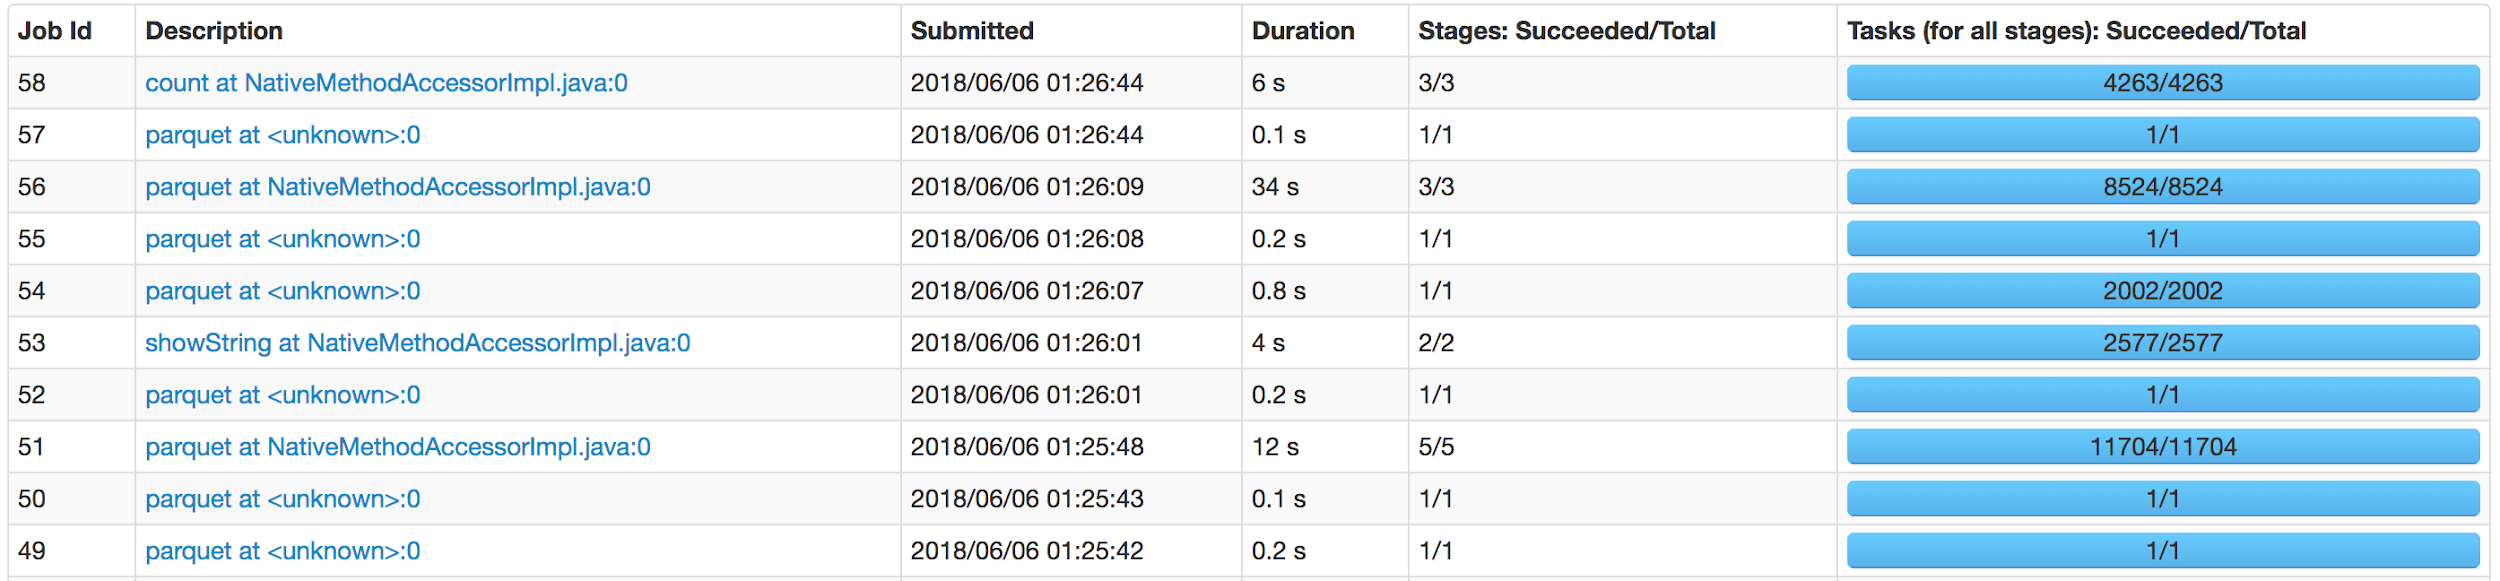
The Spark UI screenshot below was taken from an actual Spark application. It demonstrates that Spark can run multiple jobs. You can also see a number of stages and tasks executed for each job.
Resource Allocation and Spark Application Parameters
There are four major resources: memory, compute (CPU), disk, and network. Memory and compute are by far the most expensive. Understanding how much compute and memory your application requires is crucial for optimization.
You can configure how much memory and how many CPUs each executor gets. While the number of CPUs for each task is fixed, executor memory is shared between the tasks processed by a single executor.
A few key parameters provide the most impact on how Spark is executed in terms of resources: spark.executor.memory, spark.executor.cores, spark.task.cpus, spark.executor.instances, and spark.qubole.max.executors.
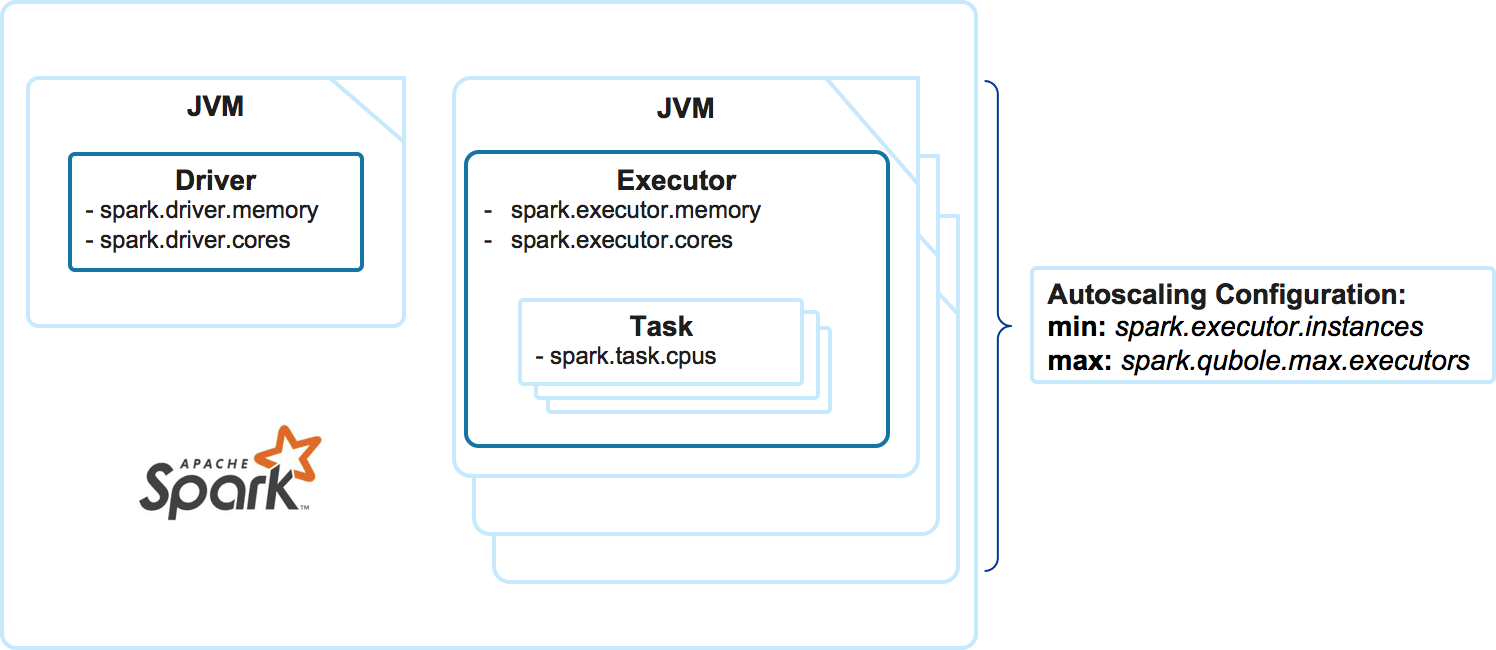
In order to understand how many tasks each executor will be able to execute, we need to divide spark.executor.cores by spark.task.cpus. Luckily, with the exception of a few scenarios, you want to set the spark.task.cpus=1.
Once you know the number of tasks a single executor can execute, you can calculate the amount of memory each task can get on average by dividing spark.executor.memory by that number.
Determining Resource Requirements
The amount of memory required for a single task is one of the most important indicators for optimizing the Spark application. This will determine what resource (memory or compute) is limiting your specific Spark application and drive your decision on choosing the instance type. On average, Spark needs between 600MB and 20GB to execute a single task. However, there is no universal formula.
One way to measure this value is to execute Spark several times with different configurations, allocating less memory every time until the job breaks with OutOfMemoryError. However, this can become a very time-consuming process.
Qubole developed a handy tool for Spark optimization – SparkLens. This tool provides information on job execution that you can utilize for optimization. One of the values you can find is PeakExecutionMem (MaxTaskMem in the older SparkLens version). This value represents the maximum amount of memory consumed by a single executor to execute tasks during actual application execution. This value is different for each stage, and you need to find the largest value. Remember that this value does not include memory for data frames, cache, etc.
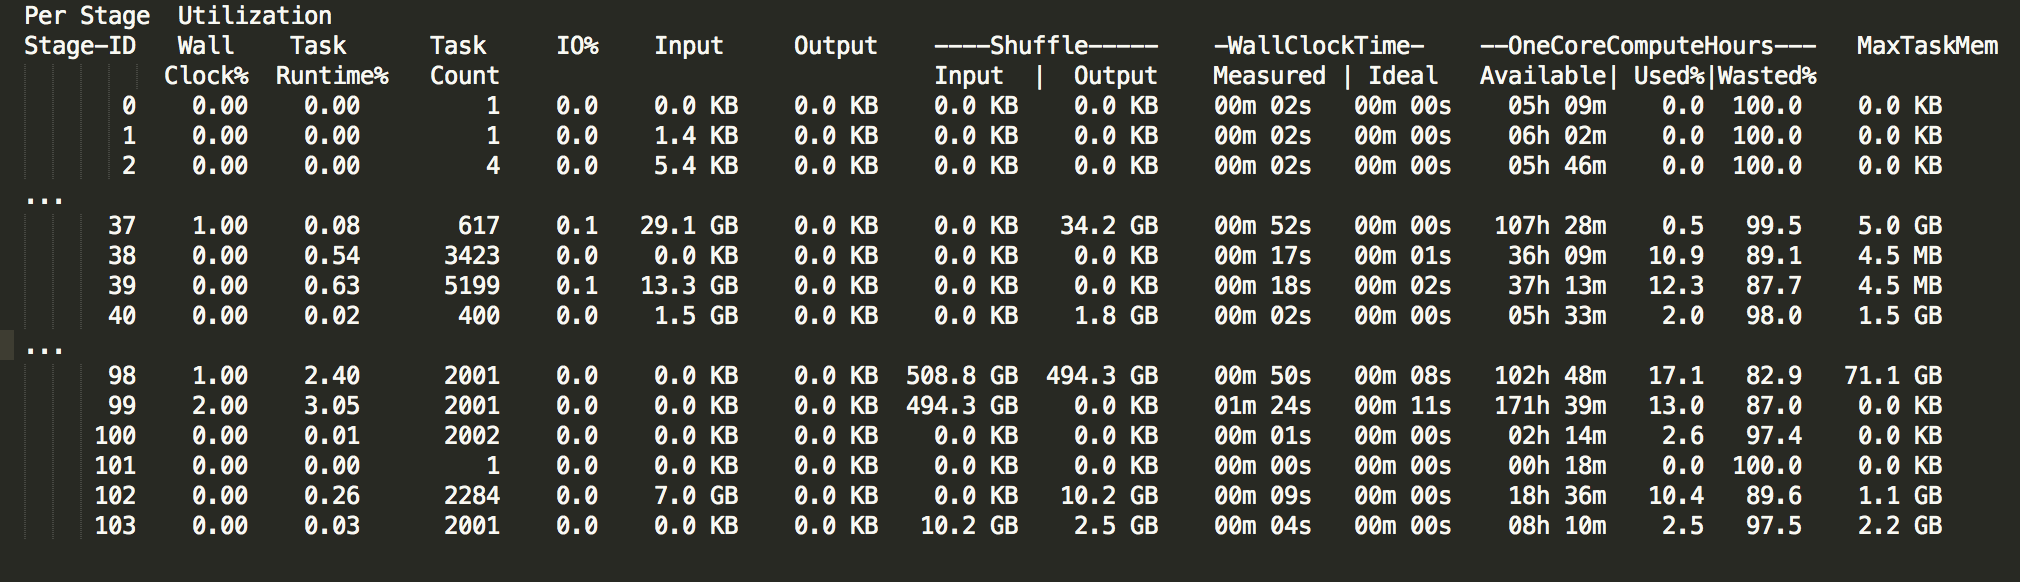
Take note of the PeakExecutionMem value along with the number of tasks executed by each executor. PeakExecutionMem divided by spark.executor.cores multiplied by a spark.task.cpus will indicate how much memory on average Spark will need to allocate for a single task to run this specific application. For the example above, we see that the largest executor took 71.1GB. With spark.executor.core=6, a task will get about 12GB on average.
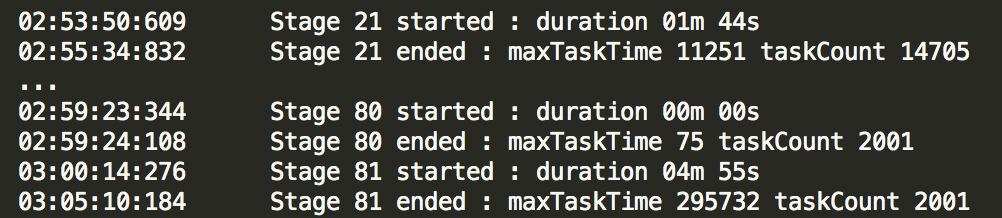
Another important indicator is how many tasks we need to execute in parallel. This information will allow us to properly size the Spark application overall as well as the Spark cluster. Information provided by SparkLens in the Application Timeline section can significantly help with deciding on the application size. Take note of the taskCount for each stage with a duration that is reasonable to address. For example, in the screenshot below, even though stage 21 processes more tasks, stage 81 takes more time and is a better target for optimizing a number of executors.
Configuring Qubole Spark Cluster
The Spark cluster configuration is well described in Qubole documentation available online. We will focus on those cluster parameters that are important for Spark application optimization — namely instance type, and the minimum and the maximum number of autoscaling nodes.
Cloud providers offer general-purpose, memory-optimized, and compute-optimized instance types. Let’s review three AWS instance types in the table below:
| c5.4xlarge (compute optimized) | r4.4xlarge (memory optimized) | m5.4xlarge (general purpose) | |
| vCPU | 16 | 16 | 16 |
| Mem, GiB | 32 | 122 | 64 |
| Cost per Hour | $0.68 | $1.064 | $0.768 |
Assuming that our Spark application needs 12GB of memory per task on average, we can calculate how much it will cost to run a single task for a full hour on each instance type. Note that one vCPU of instance type normally supports 2 Spark CPUs in Qubole Spark.
| c5.4xlarge | r4.4xlarge | m5.4xlarge | |
| vCPU | 16 | 16 | 16 |
| Mem, GiB | 32 | 122 | 64 |
| Cost per Hour | $0.68 | $1.064 | $0.768 |
| # of Tasks capacity based on vCPU | 32*2/1=64 | 32*2/1=64 | 32*2/1=64 |
| # of Tasks capacity based on Mem | 32/12=2 | 122/12=10 | 64/12=5 |
| # of Tasks capacity based on both | 2 | 10 | 5 |
| Cost of running a single Task per Hour | $0.34 | $0.106 | $0.15 |
As you can see, the cost can vary over 2x depending on the instance type, and it’s important to use the right instance type for a specific Spark application.
Configuring Spark Application
Theoretically speaking, a Spark application can complete a single task. In reality, we would like to run a Spark application in a distributed manner and efficiently utilize resources.
Let’s assume that we are dealing with a “standard” Spark application that needs one CPU per task (spark.task.cpus=1). We also found out earlier in this article that our application needs 12GB of Memory per task. We will use this value to determine spark.executor.memory and spark.executor.cores. It’s usually advisable to configure as large an executor as possible. Ideally, with r4.4xlarge instance type, we should be able to allocate all 122GiB per executor. However, OS and other processes also need some memory, so spark.executor.memory.overhead is another variable to consider. Its default value is 10% of spark.executor.memory. With all that, we can create an executor with:
spark.executor.memory = (122-6)*.9=104G
spark.executor.cores = 104GB/12GB=8
Below is a screenshot from the resource manager for the Spark application with the above configuration.

Now that we’ve decided on executor configuration, we can work on determining how many executors we need to efficiently execute this Spark application. SLA and cost will normally drive Spark application sizing.
Spark supports autoscaling with these two parameters: spark.executor.instances and spark.qubole.max.executors. Let’s consider this example SparkLens output:

If you have a very strict SLA and the cost is not an issue, you would need to find a stage with the largest number of taskCount and use this number to determine how many executors the Spark application will need in order to run all these tasks in parallel. In the screenshot above, the largest taskCount is 14705. With spark.executor.cores=8, we will need 14705/8=1839 executors. When cost is not an issue, we can set both spark.executor.instances and spark.qubole.max.executors to 1839. The cluster also needs to be configured properly to support this Spark application.
Unfortunately, in real life, we have to manage costs while achieving SLA. In order to achieve that balance, we need to ensure that the compute and memory resources are utilized in the most efficient way. In the screenshot above, stage 21 takes 1m 44s to process 14705 tasks and stage 81 takes 4m 55s to process 2001 tasks. Optimizing for stage 21, we will need 1839 executors. Optimizing for stage 81, we will need 251 executors. It’s clear that optimizing for stage 81 will save us close to 90% of the cost without significant impact on performance!
The Spark application can be further improved with autoscaling. Targeting 1839 executors for the entire application run, most of the time these executors will idle as there are not enough tasks in most of the stages to keep them busy. Having only 251 executors will slow down some stages. To resolve this dilemma, we can set spark.executor.instances=251 and spark.qubole.max.executors=1839 and that will allow Spark to scale the application out and down depending on the needs of various application stages. Autoscaling allows for the most efficient use of resources and works best on a Spark cluster shared among many applications and users.
Revisiting Spark Cluster Configuration
Empowered with values for spark.executor.instances and spark.qubole.max.executors, we can derive the minimum and the maximum number of autoscaling nodes. Keep in mind that clusters are usually shared resources and will normally run multiple jobs for multiple users at a time. The autoscaling nodes will be shared between all concurrent jobs.
Validating Configuration
Now for the exciting part! Let’s run the Spark application with the new configuration and validate our assumptions.
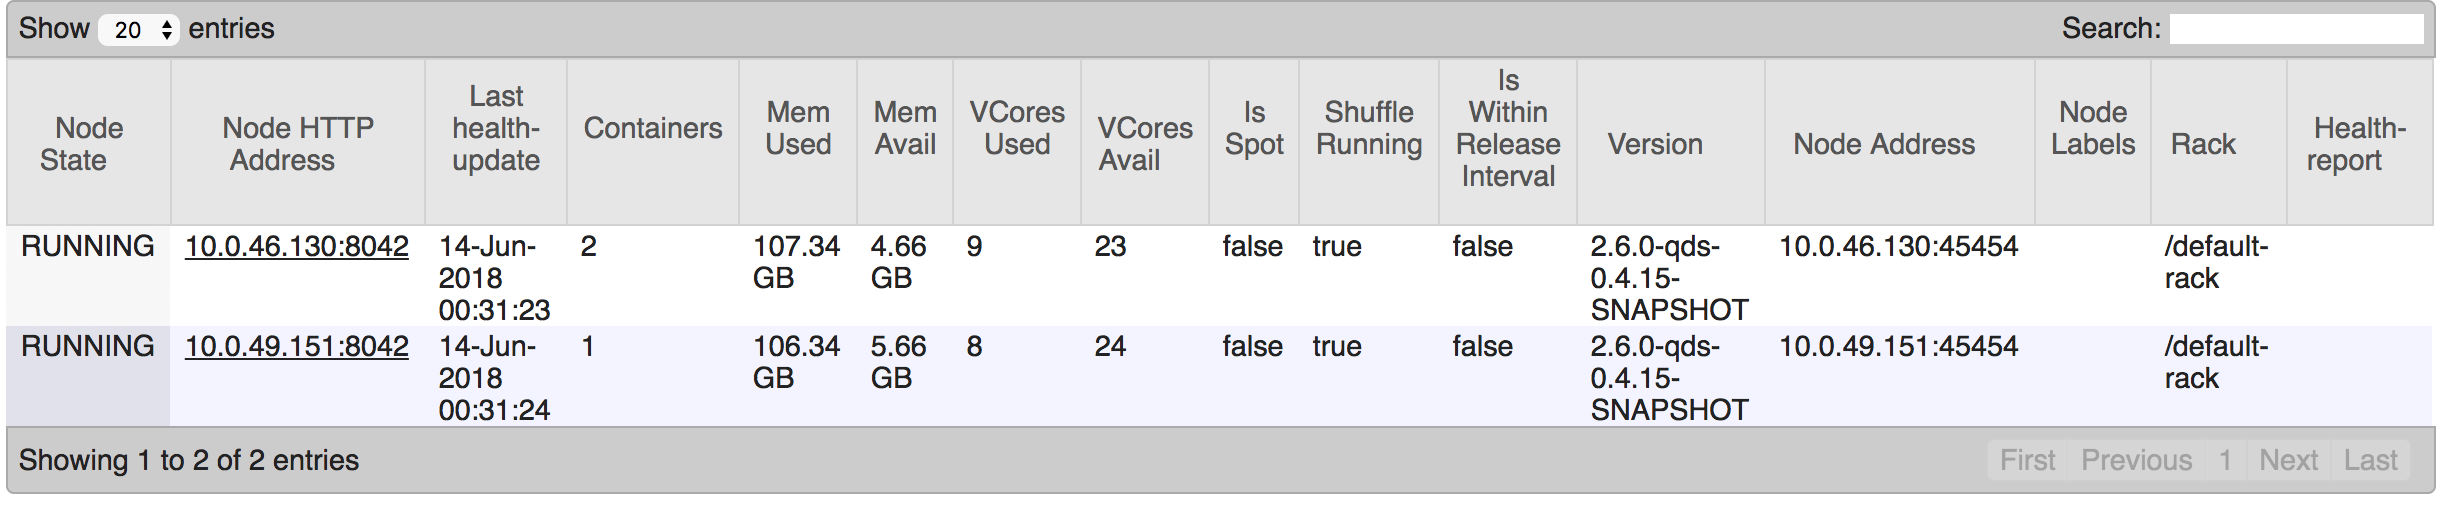
First, validate that nodes are maxed out on either compute or memory. The nodes page of the resource manager is a good tool for that. For example, the screenshot below indicates that about 4GB of memory can still be utilized.
Second, review SparkLens output to verify how many executors were running on each stage and focus on the stages that we target with our optimization.
Third, and foremost, did we achieve the SLA? Is there room for more optimization? Optimizing Spark application is an iterative process and can take time. However, the cost-benefit that can be achieved is usually well worth the effort.
Other Considerations
A driver will use one CPU on a single node. If executors are configured to utilize all CPUs generally available on an instance, the node running the driver will not be able to run a single executor as it will be one CPU short.
The data format may have a significant impact on Spark application performance. Data is usually skewed, and data splits are not even. Spark assigns data splits to executors randomly, and every Spark application run is unique from that perspective. In the worst-case scenario, Spark will place all large data split to a single executor at the same time. While this is an unlikely situation, the application configuration might need to accommodate it. However, remember that Spark will try to re-run failed tasks.
Data is processed by the Spark Application can likely change, and a tightly optimized Spark application may fail when data is floating. You need to consider the entire end-to-end process when optimizing the Spark application.
Some jobs and stages may be able to run in parallel. SparkLens reports such cases. In that case, consider stages running in parallel as a single-stage from an optimization perspective. SparkLens reports on the critical path. Pay close attention to that output, as it may significantly help with targeting specific stages for optimization.
Be cautious when optimizing a Spark application that has many stages that process many tasks but take less than a minute or two to process. Autoscaling takes time and may not be able to autoscale fast enough. See Qubole’s Spark autoscaling document for more information.
The code (Scala, Python, etc.) that the Spark application runs can be also optimized. While this is not in the scope of this article, I recommend looking at broadcasting, repartition, and other means of optimizing your code.
Spot instances on AWS is another powerful cost management tool that Qubole supports very efficiently.
Parallelism for large jobs may be limited by default value for spark.sql.shuffle.partitions. Consider increasing this from default 200.
Keep an eye on spills. Small spills can be an indicator of a stage running tight on memory. You can see spills in the SparkLens and in the Spark UI.
Finally, instance types with high I/O such as i3 may significantly increase the performance of Spark applications running a lot of data shuffling.
In Conclusion
This article is only an introduction to Spark application optimization. You can find out more about Spark tuning in our tech talk replay from Data Platforms 2018 about Supercharging the Performance of Spark Applications.
Qubole also provides Spark optimization as a part of our Professional Services, so feel free to reach out to discuss your needs.