
Introduction
In the first blog post of the series, We gave an overview of the data pipeline required to find the trending topics in Wikipedia. In the second blog post, we explained how to get the raw data and how to process it to create a filtered page-count table and a page-lookup table. In this blog, we will talk about the analysis performed on these tables to compute daily and monthly trends. Finally, we will discuss on steps involved to export the result to the Rails web app.
Normalized Page Count
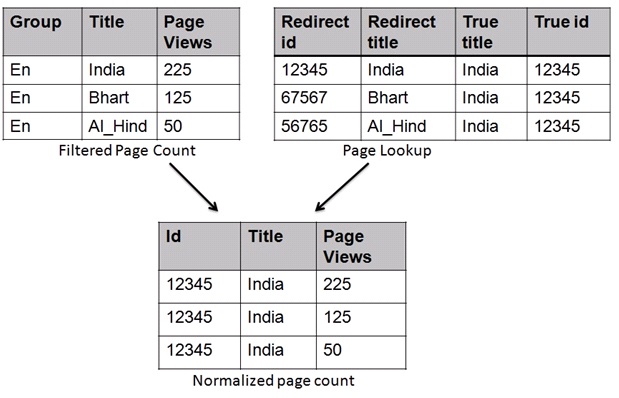
Once we have the page look-up table, we move to the next step where we normalize the filtered page counts table. Filtered page counts contain total page views per hour per day for each page title while the look-up table has the mapping between the synonyms of a page title and the actual page served. We do a left join of both tables on a page title to resolve the synonyms.
Let’s run the following hive command in the Qubole composer
set hive.exec.dynamic.partition=true;
set hive.exec.dynamic.partition.mode=nonstrict;
CREATE TABLE normalized_pagecounts (`page_id` BIGINT, `page_title` STRING, `page_url` STRING, `views` BIGINT, `bytes_sent` BIGINT) PARTITIONED BY (`date` STRING);
insert overwrite table normalized_pagecounts partition(`date`)
select pl.page_id page_id, REGEXP_REPLACE(pl.true_title, '_', ' ') page_title, pl.true_title page_url, views, bytes_sent, `date`
FROM page_lookup pl JOIN filtered_pagecounts fp on fp.page_title = pl.redirect_title;
The above command creates a new table “normalized_pagecounts” with dynamic partitions on a date. The data in the table is now well-cleansed for the out-trend algorithm.
Trend Analysis
Algorithm
We used baseline trending algorithms for our trend analysis. We can definitely have better algorithms.
Daily trend = slope * weighing factor
where slope = difference of views over a week and factor = log(1 + ∑pageviews in the week
Monthly trend = ∑pageviews in last 15 days – ∑pageviews in first 15 days
Implode Data
The first step of the implementation is to implode the data in the table per page title. The normalized page count table has hourly data partitioned by date. So we perform the following two operations
- Group the table by date and page_id, and sum the views to get total page views per day for each page title.
- Collect all such (date, page-views) entries in an array. HQL does not currently have such operations. So we have written a custom function in Java to serve our purpose. The jar file is located here. Qubole supports adding UDFs in your HQL command.
Let’s run the HQL command for this
add jar s3://dev.canopydata.com/rvenkatesh/collect_all.jar;
CREATE TEMPORARY FUNCTION collect_all AS 'com.qubole.udaf.CollectAll';
create table daily_data as  select page_id, collect_all(dt) as dates, collect_all(views) as views
from ( select np.`date` as dt, np.page_id, sum(np.views) as views from normalized_pagecounts np
group by np.`date`, np.page_id order by dt) daily_count
group by page_id;
Title | Dates | PageViews |
| India | [1 June 2013, 2 June 2013…… 30 June 2013] | [ 400, …. 300] |
Calculate Trends
The trend algorithm is implemented as a Hive UDF in Python. The script can be found on GitHub. The script reads the page-count data for each page title, applies the algorithm, and emits the daily and monthly trend value
add file s3://dev.canopydata.com/vagrawal/scripts/hive_trend_mapper.py;
DROP TABLE IF EXISTS daily_trends;
CREATE TABLE daily_trends as
 SELECT u.page_id, pl.true_title page_url, REGEXP_REPLACE(pl.true_title, '_', ' ') page_title, u.total_pageviews, u.monthly_trend, u.daily_trend, u.error
 FROM ( FROM daily_data ndt MAP ndt.page_id, ndt.dates, ndt.views USING 'hive_trend_mapper. AS page_id string, total_pageviews BIGINT,monthly_trend FLOAT, daily_trend FLOAT, error FLOAT)
u join page_lookup_nonredirect pl on u.page_id = pl.page_i
Title | As of Date | Daily Trend | Monthly Trend |
| India | 30 June 2013 | 100.45 | 2330 |
Export to WebApp
Web Application has the following DB tables
- monthly_trends – to store top monthly trends
- daily_trends – to store top daily trends
- pages – Information on the trending pages with total page views
- daily_timelines – imploded data for each of the trending pages
To populate the web DB we need to do the following two steps
- HQL command: select the top 50 monthly trends and the top 50 daily trends from our final result table (daily_trends).
- Data Export command: Once we have this data, we export the relevant values to different tables of the web app DB.
In Qubole, we can create a workflow where multiple steps are executed sequentially in one command. Also, we have a custom workflow template(query export) for running hive queries followed by a data export.
Let’s run different query export commands to populate our Webapp tables.
Export daily_trends table
insert overwrite directory 's3://your-bucket/wiki_pagecounts/tmp/daily/$yesterday$'
select cast(concat('$yesterday_trunc$', cast(page_id as string)) as bigint), page_id, daily_trend, error,
 '$yesterday_time$', '$yesterday_time$', '$yesterday$'
from daily_trends order by daily_trend desc limit 50;
Export monthly_trends table
insert overwrite directory 's3://your-bucket/wiki_pagecounts/tmp/monthly/$yesterday$'
 select cast(concat('$yesterday_trunc$', cast(page_id as string)) as bigint), '$yesterday$', page_id, monthly_trend,
 total_pageviews, '$yesterday_time$', '$yesterday_time$'
 from daily_trends order by monthly_trend desc limit 50;
Export to pages table
insert overwrite directory 's3://your-bucket/wiki_pagecounts/tmp/monthly_pages/$yesterday$' select page_id, page_url, page_title, 0, 0, 0, 0 from
 (select page_id, page_url, page_title, monthly_trend from
 daily_trends order by monthly_trend desc limit 50
 ) u;
insert overwrite directory 's3://your-bucket/wiki_pagecounts/tmp/daily_pages/$yesterday$' select page_id, page_url, page_title, 0, 0, 0, 0 from
 (select page_id, page_url, page_title, daily_trend from
 daily_trends order by daily_trend desc limit 50
 ) u;
Export to data_timelines
insert overwrite directory 's3://your-bucket/wiki_pagecounts/tmp/daily_timelines/$yesterday$'
select cast(concat('$yesterday_trunc$', cast(u1.page_id as string)) as bigint), u1.page_id, dd.dates, dd.views, 0, '$yesterday_time$', '$yesterday_time$', '$yesterday$' from (
 select distinct(page_id) from (
 select page_id, daily_trend as trend
 from daily_trends order by trend desc limit 50
 union all
 select page_id, monthly_trend as trend
 from daily_trends order by trend desc limit 50
 ) u
) u1 join daily_data dd on u1.page_id = dd.page_id
Once the data has been exported, the Data Export command will transfer the data to a MySQL instance that drives the web app.
Conclusion
In this demo, we have seen how Qubole helps in creating a data pipeline. Using different tools and connectors, we can import the data into Qubole, run various analyses, and export the result to your favorite visualization engine. It enables the data engineers to focus on streamlining data pipelines instead of cluster management. In the next section, we’ll use the Qubole Scheduler to deploy the complete data pipeline.


