
Build a Data Pipeline with Qubole
We get many questions about how Qubole makes data science easy. The one-line answer is – we have developed a number of features to help with all stages in a data pipeline’s lifecycle – import data, analyze, visualize and deploy to production. However, the best way to answer these questions is by letting the product talk. We have created a demo to showcase how Qubole lowers the barrier to leveraging the power of Apache Hive with Hadoop.
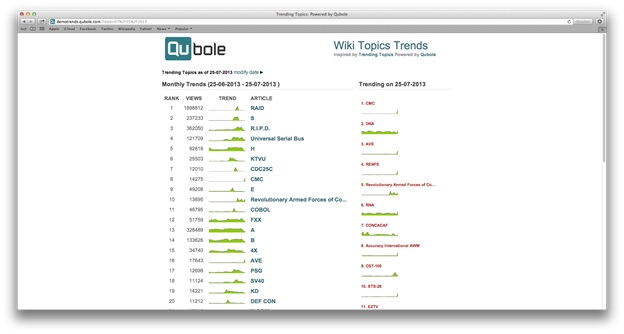
Wikimedia, the organization behind Wikipedia publishes the page views of each topic, every hour of the day. From the page views, trending topics i.e. those topics with sudden jumps in page views can be found. We are not the first ones to attempt such an exercise. Data Wrangling has documented a previous attempt here.
We have also deployed a rails app to visualize the results at https://demotrends.qubole.com. The code for the Rails app is available on GitHub.
Requirements to run the demo
- Qubole Trial Plan
OR
- An Amazon Web Services account
- Qubole Free Plan
PageCount Data
On the Wikimedia website, the data is partitioned by year followed by month. There is one directory per year starting from 2007. Each year has one directory per month. For e.g. in the year 2013, there are directories named
- 2013-01
- 2013-02
- 2013-03
- 2013-04
- 2013-05
- 2013-06
- 2013-07
Each month’s directory has one file for every hour of the day. For e.g.
- pagecounts-20130701-000000.gz, size 85M
- pagecounts-20130701-010000.gz, size 85M
- pagecounts-20130701-020000.gz, size 81M
- pagecounts-20130701-030000.gz, size 80M
- pagecounts-20130701-040000.gz, size 80M
….. - pagecounts-20130704-110000.gz, size 95M
- pagecounts-20130704-120000.gz, size 95M
- pagecounts-20130704-130000.gz, size 99M
- pagecounts-20130704-140000.gz, size 99M
- pagecounts-20130704-150000.gz, size 99M
Let’s take a peek at the page count data feed. Each row ends with a new line ‘\n’. There are 4 columns in each row and the columns are separated by a space.
| Column | Description |
| Group | A category is chosen by Wikipedia. |
| Title | Name of the topic |
| Page Views | No. of views of each topic in an hour |
| Bytes Sent | No. of bytes served by the server in an hour |
A sample of the rows are:
| Group | Title | Page Views | Bytes Sent |
| En | India | 1265 | 155611676 |
| En | Al_Hind | 1 | 745733 |
| Af | 2007_Super_14-seisoen | 14 | 91226 |
| Af | 2008_Super_14-seisoen | 14 | 27131 |
| En | Ubuntu_(Operating_System) | 19 | 366003 |
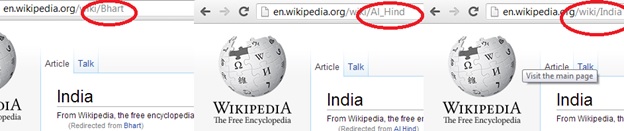
Resolve Synonyms
The page titles in a row can be synonyms. For e.g. “Bhart”, “Al_Hind” and “India” redirect to the same Article of India on Wikipedia, ie these 3 are synonyms and Wikipedia keeps track of synonyms. Wikipedia calls the synonym page titles “Redirect Titles”.
The page visit count data that we discussed above gives info about page visits for “Bhart”, “Al_Hind” and “India” separately. To get the actual page visit count of “India” we need to aggregate the data for all synonyms/Redirect titles for “India”. Wikipedia publishes the data about page synonyms in form of 2 dimension tables.
| Page Id | Page Title |
| 12345 | India |
| 67567 | Bhart |
| 56765 | Al_Hind |
| Redirect from | Page Title |
| 67567 | India |
| 56765 | India |
Page Table has an entry for each page that exists in the wiki. The redirect table has an entry for only redirect page ids. We need to join these two tables to get a lookup table.
| Redirect Id | Redirect Title | True Title | True Id |
| 12345 | India | India | 12345 |
| 67567 | Bhart | India | 12345 |
| 56765 | Al_Hind | India | 12345 |
We can then use this lookup table to find the True Title for any redirect table.
Final Output
The final output exported to the web app looks like
| Date | Title | Monthly Trend | Daily Trend |
| 2013-07-13 | India | 3456 | 129908.6 |
Flowchart
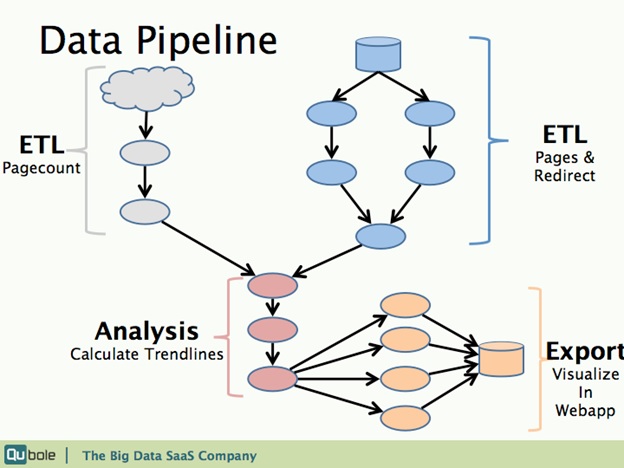
The data pipeline is visualized in the flowchart shown above. There are four distinct parts:
- Import and clean up Pagecount
- Import and join Pages & Redirect tables to create a lookup table.
- Resolve Synonyms and calculate trend ranks for each topic.
- Export the results to the web app database.
In the second part of the blog series, we’ll describe the ETL steps required to process the raw data.
In the third part, we’ll describe the analysis and export steps.


