Motivation
One of Qubole Data Services’ most popular offerings is Hive-as-a-Service in the cloud. Users run a large number of ad-hoc, analytical Hive queries against their data in S3 or HDFS. It wasn’t apparent to us how many of these queries were truly unique and how many were simple variants. The hypothesis was that if we could identify a core set of query patterns, users could focus on optimizing them by rewriting them or changing schemas. This post details our efforts in canonicalizing and classifying hive queries and identifying the relative share of CPU and I/O used up by the most popular query patterns.
Approach
We attempted to canonicalize queries using a simple heuristic: scrub all literals from the queries and group them. As an example, the following queries would be grouped together:
Query A:
SELECT country,
count(*),
sum(duration)
FROM visits
WHERE region = ‘Americas’
GROUP BY country HAVING count(*) > 100000;
Query B:
SELECT country,
count(*),
sum(duration)
FROM visits
WHERE region = ‘Asia-Pacific’
GROUP BY country HAVING count(*) > 50000;
One way to do this canonicalization is to use regular expressions to find all these literals and scrub them. Using regular expressions to find literal, is, however, very error-prone. So, we decided to use the hive parser to do the canonicalization. This involved the following steps:
- Get the exact SQL text submitted by the user. This may contain some comments and some set/add commands. It may also contain multiple hive queries (separated by a semicolon.)
- Strip comments and all the sets, and add list commands. These are valid commands but are not interesting for our purposes.
- Split the resulting string using the semicolon as the separator into individual Hive queries.
- Use Hive’s internal parser to construct an Abstract Syntax Tree (AST) from each individual Hive query.
- The walkthrough that AST and find out all the nodes which represent literals (string literals, integer literals, etc.) Replace all those literals with the word ‘LITERAL’.
- Serialize the resulting AST into text. This corresponds to a canonicalized version of the original Hive query. For the above examples, the serialized AST would be:
1 | (null(TOK_QUERY(TOK_FROM(TOK_TABREF(TOK_TABNAME(visits))))(TOK_INSERT(TOK_DESTINATION(TOK_DIR(TOK_TMP_FILE)))(TOK_SELECT(TOK_SELEXPR(TOK_TABLE_OR_COL(country)))(TOK_SELEXPR(TOK_FUNCTIONSTAR(count)))(TOK_SELEXPR(TOK_FUNCTION(sum)(TOK_TABLE_OR_COL(duration)))))(TOK_WHERE(=(TOK_TABLE_OR_COL(region))(LITERAL)))(TOK_GROUPBY(TOK_TABLE_OR_COL(country)))(TOK_HAVING(>(TOK_FUNCTIONSTAR(count))(LITERAL)))))(<EOF>))
|
We exposed this canonicalize method to our rails app as a thrift service using the Qubole Hive Server. Now whenever a query completes execution, we canonicalize it. We then look in the database for the canonical query corresponding to this query and update the count and metrics for that canonical query. We also ran the canonicalization code over all the historical queries run in Qubole Data Service.
Results
We got some interesting results from this exercise:
- On average, each canonical query is run around 16 times (with different parameters). The ratio of total hive queries to total canonical queries is 16.19.
- The most frequently executed canonical query on the Qubole Data Service has been executed more than 38000 times.
We also found that, for most users, the top few canonical queries consume most of the total CPU time. Below is a graph showing the percentage of the cumulative CPU ms consumed by queries belonging to the top 20 and top 50 canonical queries for different users.
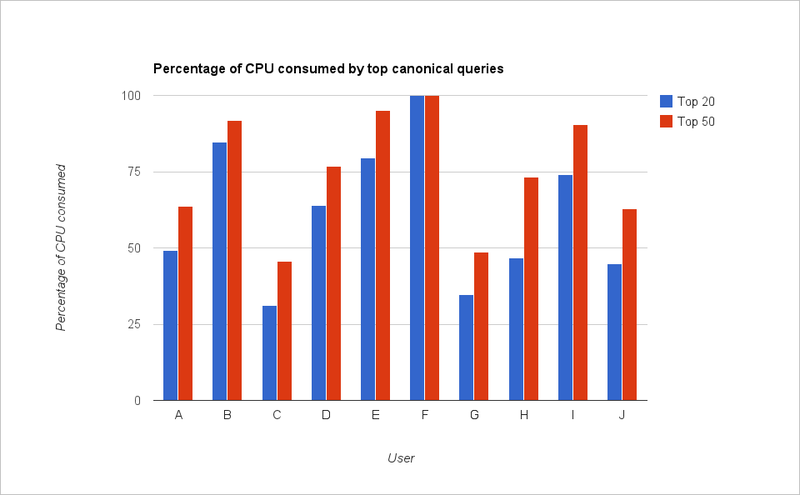
A-J represents different accounts in Qubole Data Service. As you can see, queries belonging to the top 50 canonical queries consume more than 50% of the CPU for most users. This information is invaluable in determining which type of queries to optimize.
Accessing Your Report
Users can now access this report for their accounts using our API. You can also use Qubole Python SDK to get this report.
Here are some examples to help you get started (using our SDK):
Most frequently executed canonical queries:
qds.py report canonical_hive_commands --sort frequencyCanonical queries consuming the most CPU:
qds.py report canonical_hive_commands --sort cpuCanonical queries consuming the most CPU during a given time period:
qds.py report canonical_hive_commands --sort cpu --start-date 2014-04-01 --end-date 2014-04-30Future Work
Our next step is to look for similar canonicalization heuristics for Map Reduce/Pig/Presto etc. Stay tuned for more updates on this!


